
Introduction
Lumar is designed for massive scale and we regularly crawl, track and analyze millions of URLs for our clients. But with scale can come challenges. With a huge amount of data, how do you use Lumar to ensure you get to the bottom of issues quickly and easily?
And that’s exactly the question we’ll answer in this guide. But first, let’s just cover what we mean by efficiency.
For us, it boils down to three key areas:
- Making sense of extensive data and cutting through noise
- Meeting budgets
- Being able to take action on insights easily
In this guide, we’ll look at efficient crawl strategies to keep costs down, and efficient reporting to get you to the insights you need, so you can prioritize and fix issues effectively.
Efficient Crawl Strategies
When people start looking into their website’s technical health, a common assumption is that a full site crawl is the best approach. Often, this is due to thinking along the lines of:
- “I need a list of every single SEO issue on the site so we can write stories in JIRA”.
- “We need to crawl every single URL on the site”.
- “We need to know about issues as soon as they happen”.
But here’s the good news. Almost nobody actually wants a full site crawl.
Smart Credit Usage
First, let’s take a look at how to effectively use your crawl credits. Crawl credits help ensure costs are kept to a minimum. As crawls will incur a cost for any vendor, unlimited crawling means you’d likely be paying over and above what you need to, so the vendor isn’t out of pocket.
When looking at creating an efficient crawl strategy, we need to think about a few different areas:
- Site Sections: What sections of the site can we actually get changes made on?
- Sources: How can we reduce (or eliminate) noise from our dashboards?
- Release Pace: How often should we be crawling to find new issues in a timely way?
- Level vs URLs: How do we make sure crawls are broad and deep without being wasteful?
- Scheduling: How do we make sure we’re focusing on important stuff, but staying within budget?
- Group/Section: Do we need to crawl every single page if we know they’re all the same?
Let’s take a look at each of these in turn.
Site Sections
To start with, find out where development resource is usually spent. That means you can make sure you’re crawling sections and pages that will actually get fixed. If certain pages aren’t going to get the resources you need to fix them, then they’re less important for regular crawling.
And think about your ‘money’ pages—the pages that will drive conversions or revenue for your business. These are the critical pages that you want to know when something happens, so they’re more important for regular crawling.
Sources
For sources, think about the purpose of the crawl. Logs or Google Analytics are great sources for URLs, but adding them to a crawl can make it noisy. Depending on the purpose of the crawl, would a URL list do the job just as well? Also don’t just include ALL sitemaps in a crawl. Again, think about the purpose of the crawl, and what sources make most sense to get you the data you need.
Release Pace
You also need to consider when it makes most sense to complete your crawls. For example, you could crawl based on your release/sprint cadence, or crawl the live site just after changes occur. If you have a good working relationship with devs, think about an API event. And don’t forget that crawling QA can help catch potential issues early, and Lumar Protect can help automate that process.
URLs vs Levels
This one requires a bit of a fine balance as you need the crawl to be broad and deep enough to spot issues, but make your crawls too lean and you might miss issues in particular areas.
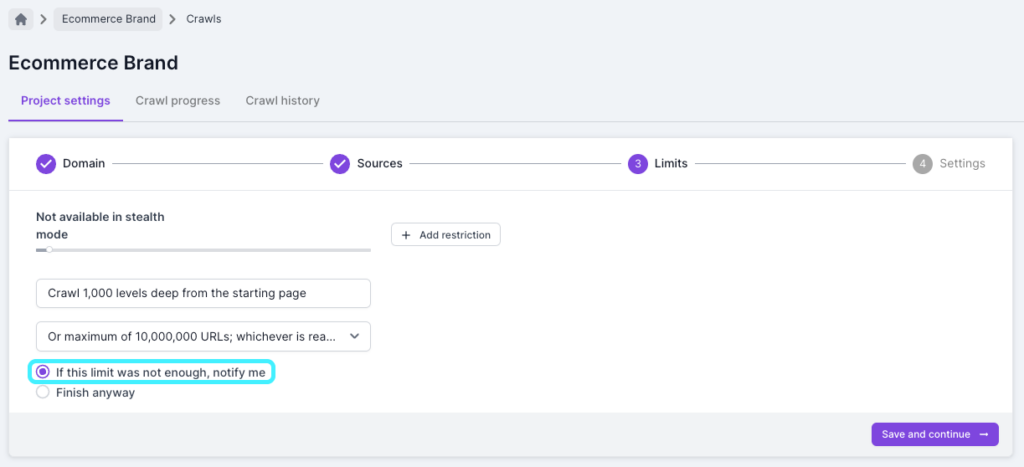
The default limits for a project are 100,000 URLs and 100 levels. Each level is based on clicks from the starting page so the default limit can be quite high for some websites. When looking to improve efficiency we recommend setting a more natural level and URL limit for your projects.
This is to avoid potential credit wastage if a website update causes a spider trap which ends up crawling a lot of URLs. In Step 3 of the crawl settings, you can check the box to get a notification if limits are reached so you’ll get an early warning that the crawl might be bigger than expected.
For larger websites setting a level limit can be really useful when you can’t crawl the entire website, as you can crawl to a specific level and compare URLs based on that.
When starting to crawl a new website we recommend first a small crawl to test whitelisting, but then a larger unrestricted crawl as a baseline. The URL limit set for this should be based on the credits available, but the purpose of this is to have a crawl which you can analyze to see which parts you may not want to crawl going forward.
As mentioned above, you want to make your projects and crawls as efficient as possible, but you don’t want to set limits too low and miss issues.
Scheduling
As a rule, you’ll want to crawl your primary sections as often as possible. You can then consider tiering sections after this to create a schedule that works for you. Lumar is very flexible, so you have a range of options available that can help reduce credit usage. For example, crawling 500 URLs monthly is 12.5% of a weekly 1k URL crawl. We would recommend leaving a few extras for ad-hoc work that might come up.
Setting up a varied crawl strategy can help you to be more efficient while also making sure you have as much useful data as possible. We recommend to set up a larger baseline crawl first with as few restrictions as possible, and run the crawl less frequently (e.g. monthly).
It’s then a good idea to create more projects that crawl important sections or pages—like a category section for an eCommerce site. Finally, we always recommend keeping a project for crawling a list of the important URLs. As this will be a small list of specific URLs, you can set these to run daily.
When setting up a lot of projects with scheduled crawls, it’s important to make sure they don’t all run at the same time, and are set for different dates across the month. Not only is this better for the website, but it also means you will always have fresh data to look at regardless of the date.
When creating your strategy it’s good to leave extra URLs for ad-hoc projects that might be more bespoke, such as development website crawls or competitor crawls.
Group/Section
When working on a crawl strategy, you also need to consider what you do or do not want to crawl. Most websites will have multiple templates, which are sections built in the same way and normally identical apart from the content and URLs. An example would be a product page template that shows product information. If a section breaks on your product template, then it is likely to break on all product URLs. You may, therefore, not need to crawl all of your product pages to identify issues.
It’s also easy for a small issue to look much more serious at scale. One broken link on the product page template might have turned into a massive 10,000 URL spike in the internal broken links report, setting off a lot of alarm bells and overshadowing the noindex tag that’s just been added to the homepage.
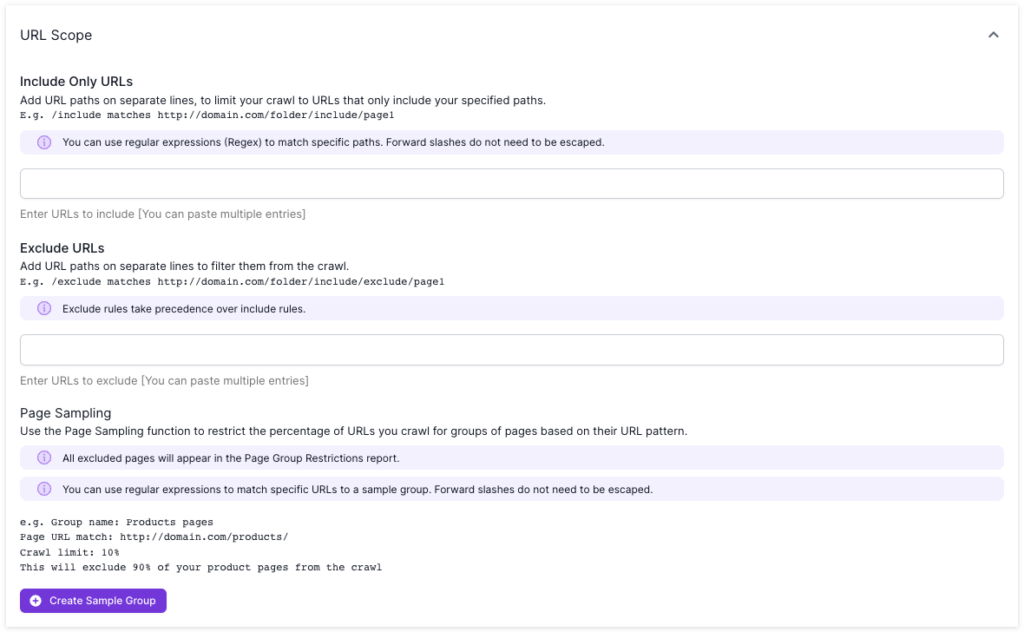
Use page sampling to crawl a percentage of URLs
Lumar also has a Page Sampling feature where, if there is a common URL path, you can choose to only crawl a percentage of those URLs found. Continuing the product template theme, you could therefore choose to crawl 10% of those rather than the entire set.
Use Include rules to only crawl specific sections
You can also use ‘Include Only’ rules to crawl specific sections. For example if you only wanted to crawl a /magazine/ section then (depending on your site configuration) you could just set the start URL to /magazine/ and add /magazine/ in the include only settings.
Use Exclude to not crawl pages/sections
If there is a section that you don’t want to be crawled, you can also exclude it. For example, you can choose to crawl everything but your /blog/ section. You can also use RegEx rules for both include and exclude rules.
One thing to be aware of when setting restrictions is that orphan reports may flag false positives. For example, excluded pages won’t be crawled which means it can prevent other URLs from being found. This is why it’s recommended to have a larger, unrestricted crawl as a baseline where possible. If you want to see which URLs were discovered but have not been crawled due to restrictions you can look in the ‘Uncrawled URLs’ report.
You’ll find the settings for Page Sampling, Include Only URLs and Exclude URLs in Step 4 of the Analyze crawl settings, in Advanced Settings > Scope > URL Scope. Find out more about restricting a crawl to certain pages.
Efficient Reporting
As hard as it is to admit, we know not everyone will wake up every morning excited to review crawl data. So here’s a few tips to get you to the insights you need as quickly as possible.
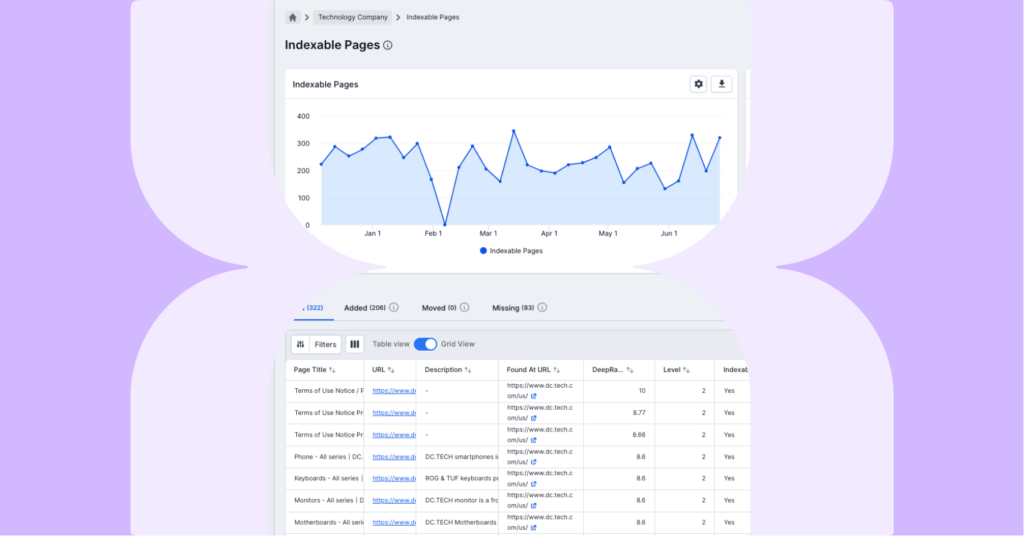
Top Errors Report
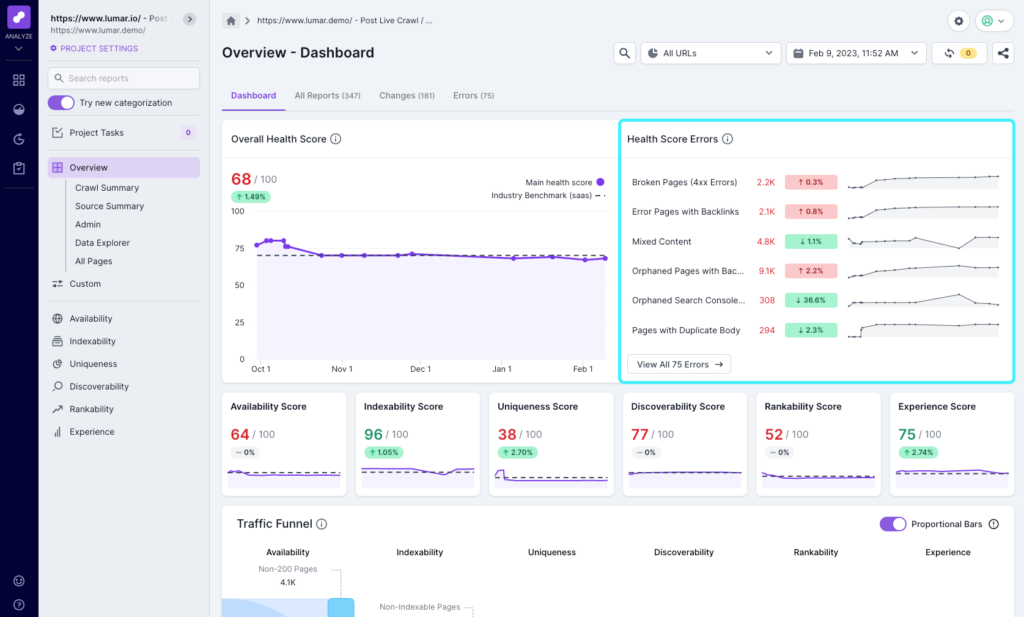
Every crawl has a top errors report, and any scheduled crawl with more than one run will have a changes report to show you what’s changed since the last crawl. This is great for quickly spotting new or large issues that need investigation and fixing. On the dashboard overview you’ll see the Top Errors and Top Changes, where you can click through to see the full report. You can also access the full report using the links at the top of the screen.
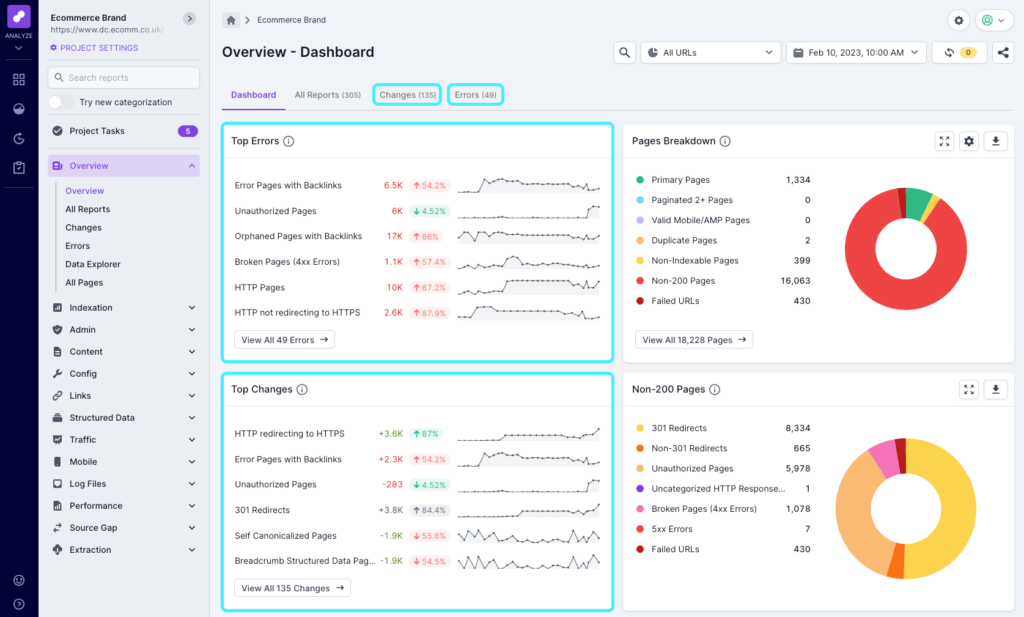
If you have our health scores as part of your subscription, you’ll also see errors relating to the Overall Health Score in the top right corner of the dashboard. As you click into different categories and subcategories, this will update to reflect the errors for the health score you’re viewing.
Segmentation
Segmentation is a feature we highly recommend setting up in your projects. It allows you to segment your website URLs based on any of the metrics in Lumar as well as custom extractions, which allows you to focus on the most important sets of pages.
When set up, you can view dashboards and reports by using the Segment drop-down, so you can see things like top errors and changes just for the URLs in the segment you’ve chosen. You’ll also see a list of top segments affected within report data, so you can easily see affected templates.
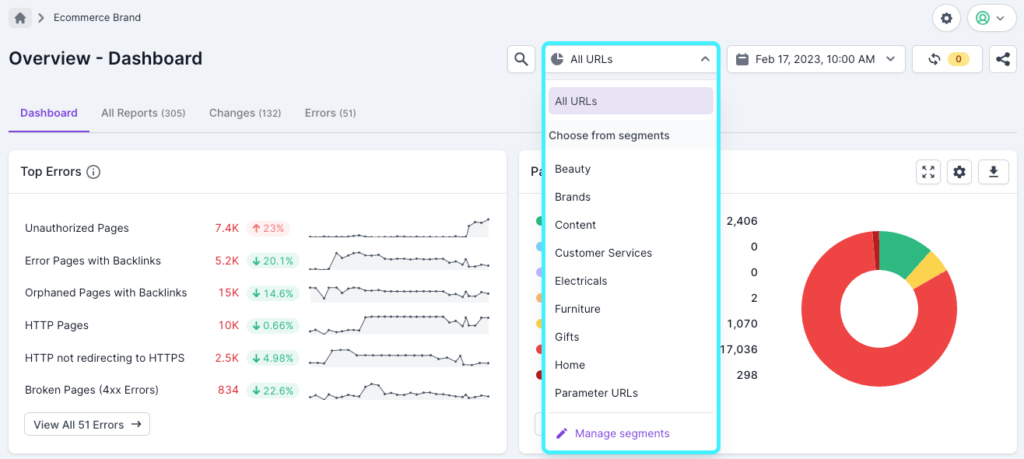
As an example, for eCommerce sites you can set up segments for products and categories. If you don’t have a recognizable URL path to segment by, you can use product schema count >1 or a unique element of the code to extract. Another use case would be to keep track of errors on older and newer parts of a site. So if you have an old WordPress section, you could extract a unique element of that page that signals it to be WordPress.
Find out more about Segmentation in Lumar, including how to create and edit them.
Task Manager
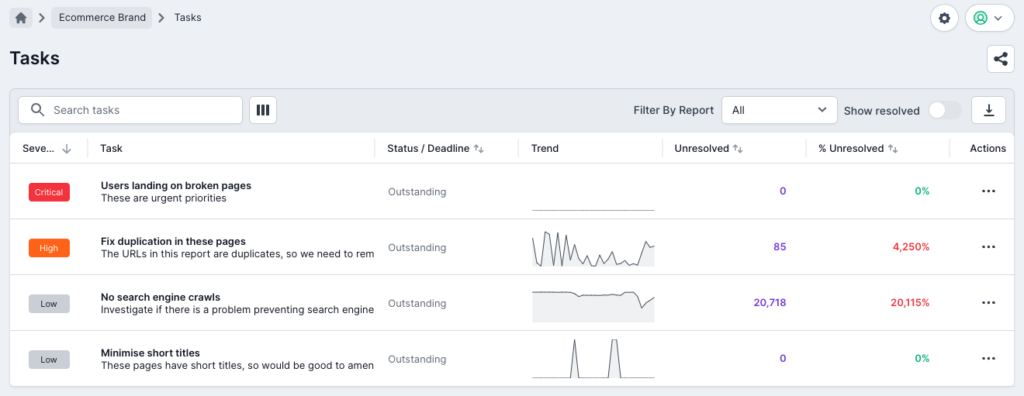
Tasks are a great way to keep track of very specific issues or common problems in your projects. You can create a task out of any single report, including any filters you’ve set or segments you’ve selected. This allows you to track very specific issues within large datasets.
For example, you might have spotted some incorrect canonical tags on a product template, so you can use filters in the canonicalized report to show just /product/ URLs to highlight the issue. Then click the ‘create task’ button on the report to track any changes to the canonicals, and see when the issue gets fixed. You can also assign email addresses to each task, so if a team member is responsible for a particular issue or section, they will receive email updates after each crawl notifying them of any changes.
Find out more about Lumar’s Task Manager, including how to create tasks.
Data Explorer
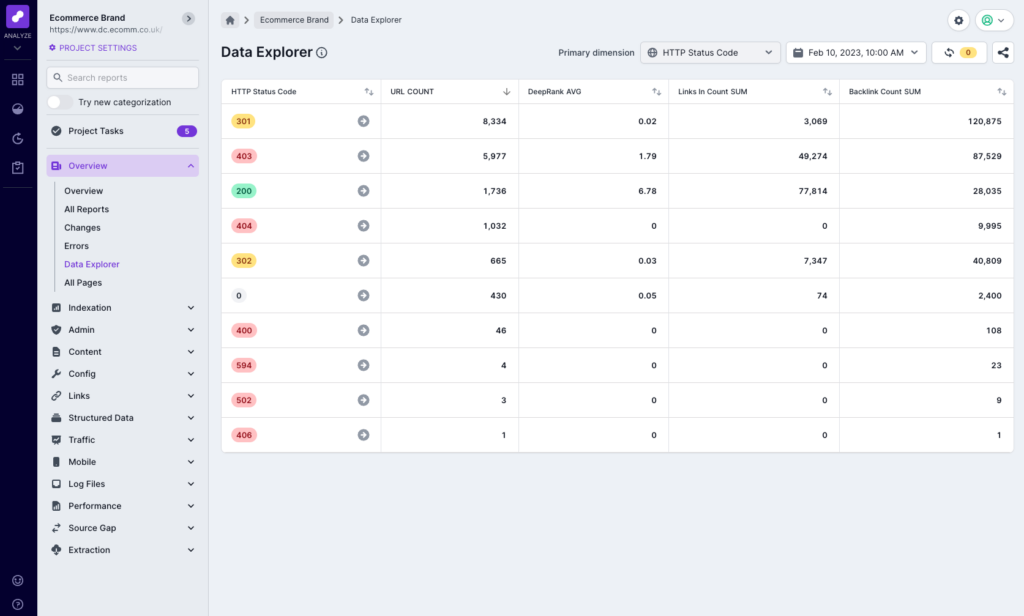
Data Explorer allows you to quickly and easily summarize crawl data to help with analysis, and to understand where improvements could be made. You can select a dimension, such as URL Path or Segment, and then choose any numeric metric and aggregate function for the columns.
A common way to use Data Explorer is to choose URL Path after a crawl has finished, to quickly see the folders and subfolders that were found. This can often highlight any dev domains that might be linked, or incorrect folders that you didn’t even know existed.
You can also use Data Explorer to review internal linking differences between segments or folders. If you select DeepRank and AVG, you can see the average internal linking score which can give an indication of segments that might not be well linked.
Find out more about Lumar’s Data Explorer.
Dashboards
Lumar includes dashboards for every category and subcategory, helping you hone in on the issues that you need to address. But Lumar can also easily be plugged into Google Looker (formerly Data Studio). We’ve built a template report, or you can build your own dashboards featuring just the metrics you need or want to share with your stakeholders. Find out more about the Lumar Google Looker Studio Connector or check out the Lumar Google Looker Studio template.
So far, we’ve been focusing on Lumar Analyze, but our other apps also provide ways for you to find, prioritize and fix issues as quickly as possible, and work more efficiently.
Monitor
Monitor gives you a high-level view of projects or domains in one place, so it’s really useful for scanning across several projects to quickly spot issues or trends that need addressing. This could be different domains or geographies or, if you’re using Lumar in an agency, a group of different clients as part of a Monday morning checkup. Conversely, Monitor is also great for checking really niche issues or as a tool for monitoring very specific projects.
Monitor also provides completely customizable alerts, so you can focus on what matters most and get notified via email, Slack or Teams when specific metrics pass a threshold or meet certain criteria. The customizable nature of the alerts means you only get notified for what matters and cut out the noise, and helps reduce admin by allowing our platform to suggest, or automatically apply new thresholds when appropriate.
Find out more about Lumar Monitor, including how to get started.
Protect
Up to now, we’ve also focused on a reactive approach to website technical health, by identifying issues that need addressing on your live site. However, uniquely, Lumar also provides a proactive approach to website technical health, by identifying issues before they’re published to your site and protect your traffic or potential revenue.
Lumar Protect has more than 200 automated tests to uncover potentially painful errors, so you can use time spent fixing bugs on proactive, strategic work. Direct integration into the CI/CD pipeline can also reduce impact on the production environment, and development costs.
Find out more about Lumar Protect.
Impact
Our Impact app is designed to provide Digital Leaders (such as digital marketers, growth leaders, product managers, etc.) with access to our traffic funnel, health scores and industry benchmarking in a separate app. This allows them to focus on the high-level information so they can quickly see how things are progressing, and identify opportunities for growth.
Find out more about Impact, and our traffic funnel, health scores and benchmarks.


