
The Lumar Google Looker Studio Connector (previously Google Data Studio Connector) allows you to access your Lumar data directly in Google Looker Studio (GLS), without having to know any code. And, we’ve created a Google Looker Studio Technical SEO template to help you get a head start using your Lumar data in Looker Studio!
There are 13 pages to the Lumar Tech SEO Template, powered by three separate data types from the Lumar Connector. Here’s the breakdown:
- Projects Page Types – Crawl Data
- Project HTTP Status – Crawl Data
- Segmentation Page Types – Crawl Data
- Segmentation HTTP Status – Crawl Data
- Issues Overview – Issues
- Tasks Overview – Tasks
- Page Breakdown & Canonicals – Crawl Data
- Content Review – Crawl Data
- Internal Links & Backlinks – Crawl Data
- Performance Metrics – Crawl Data
- Structured Data – Crawl Data
- Sitemaps Details – Crawl Data
- Traffic Metrics – Crawl Data
- Setup & Documentation
Google Looker Studio allows for a ton of customization, so feel free to think of this template as just the starting point! Once you’re done reading about the pages within the dashboard and their intended purpose, keep on scrolling for some ideas to customize the template into something even more meaningful for your website(s)!
Getting Started
There are many ways to set up the template in Google Looker Studio, but our recommended steps are outlined here.
Important: The template requires the “Allow ‘Crawl Selection’ to be modified in reports” checkbox to be selected. Omitting this will prevent the template from working correctly.
Once you’ve set up the Connector and all three data sources appear in your Google Looker Studio account, open the Lumar Looker Studio Template.
Click on the ellipsis at the top right of the template and choose ‘Make a copy’.
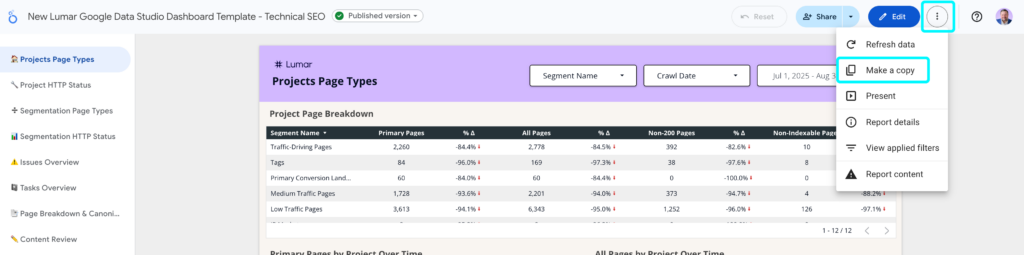
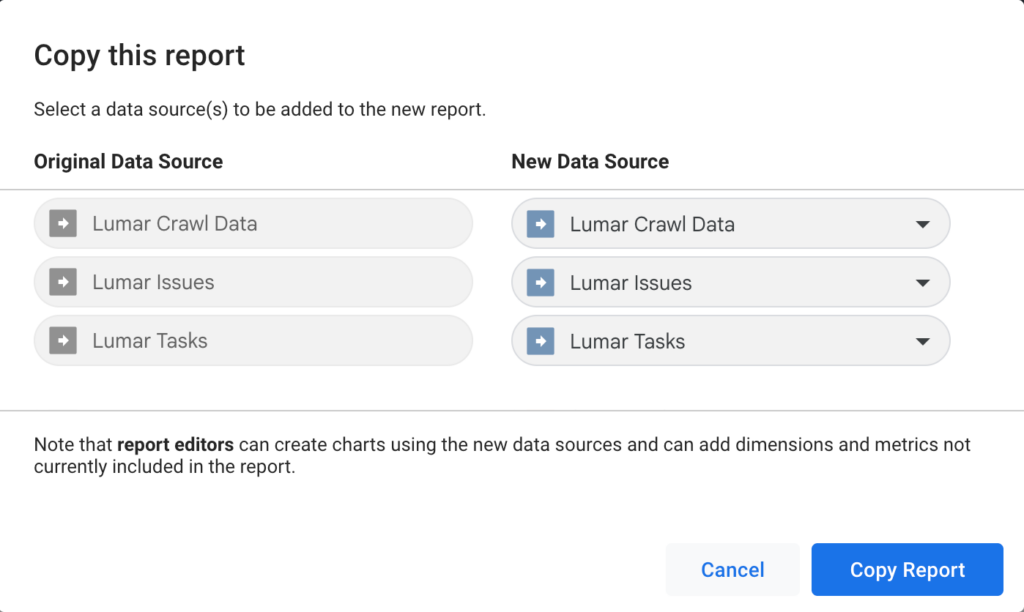
Change the New Data Sources to match the data sources you created when you set up the Connector, and click ‘Copy Report’ and your new data sources will be loaded into the template.
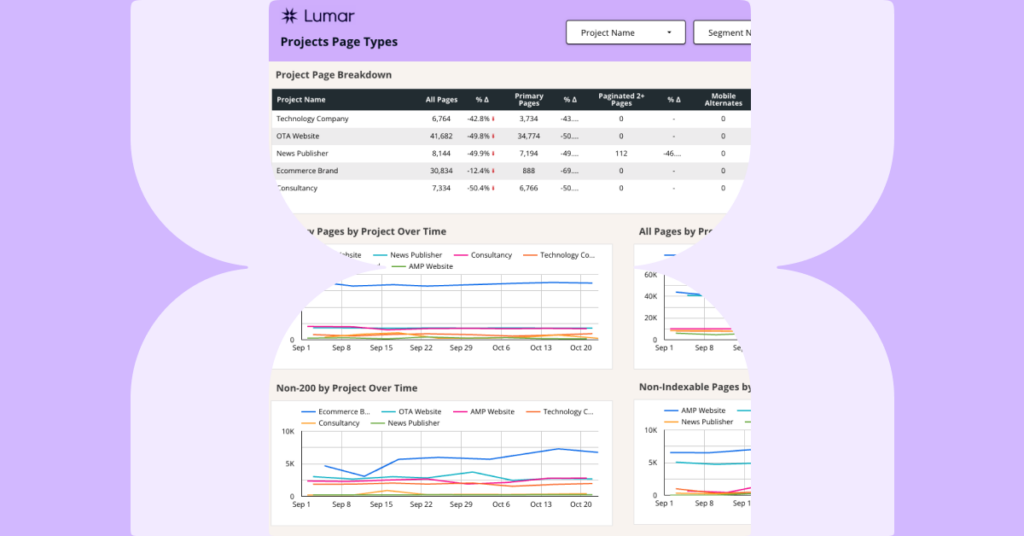
Monitor Page Type Reports Across All Your Projects
The first page breaks down pages by type – similar to what you’ll find in the main dashboard within the app. What’s different is that you’re able to monitor all of your projects at once instead of one at a time. The table at the top of the page shows the most recent crawl vs the previous crawl and the charts below show the page breakdown over time.
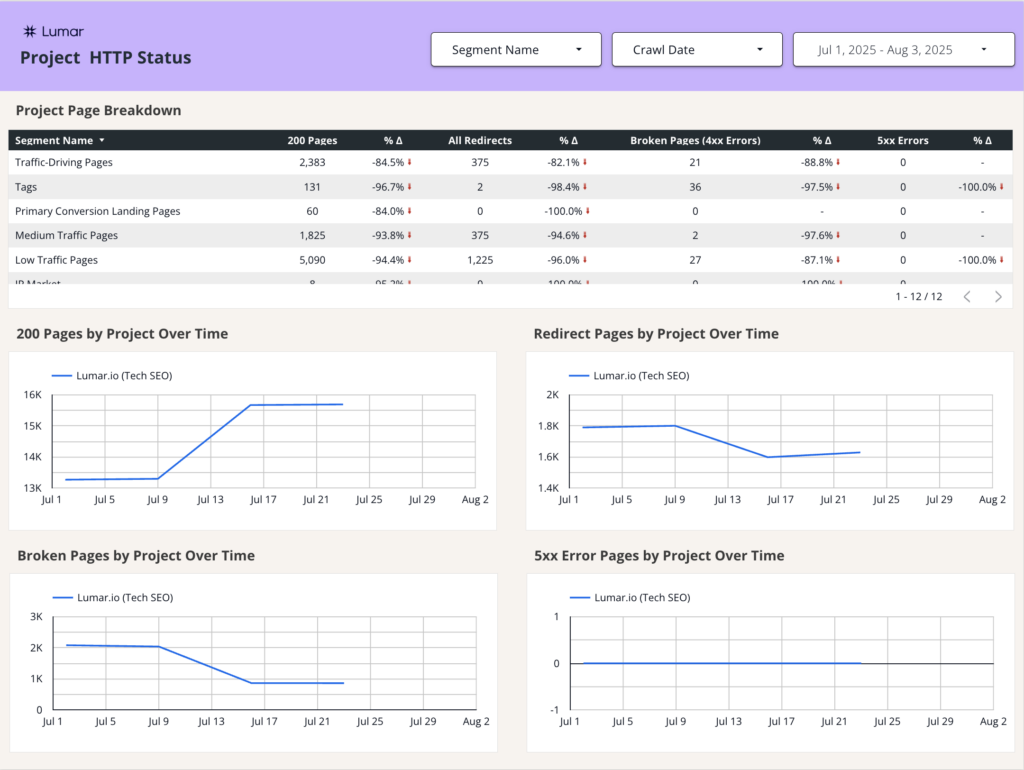
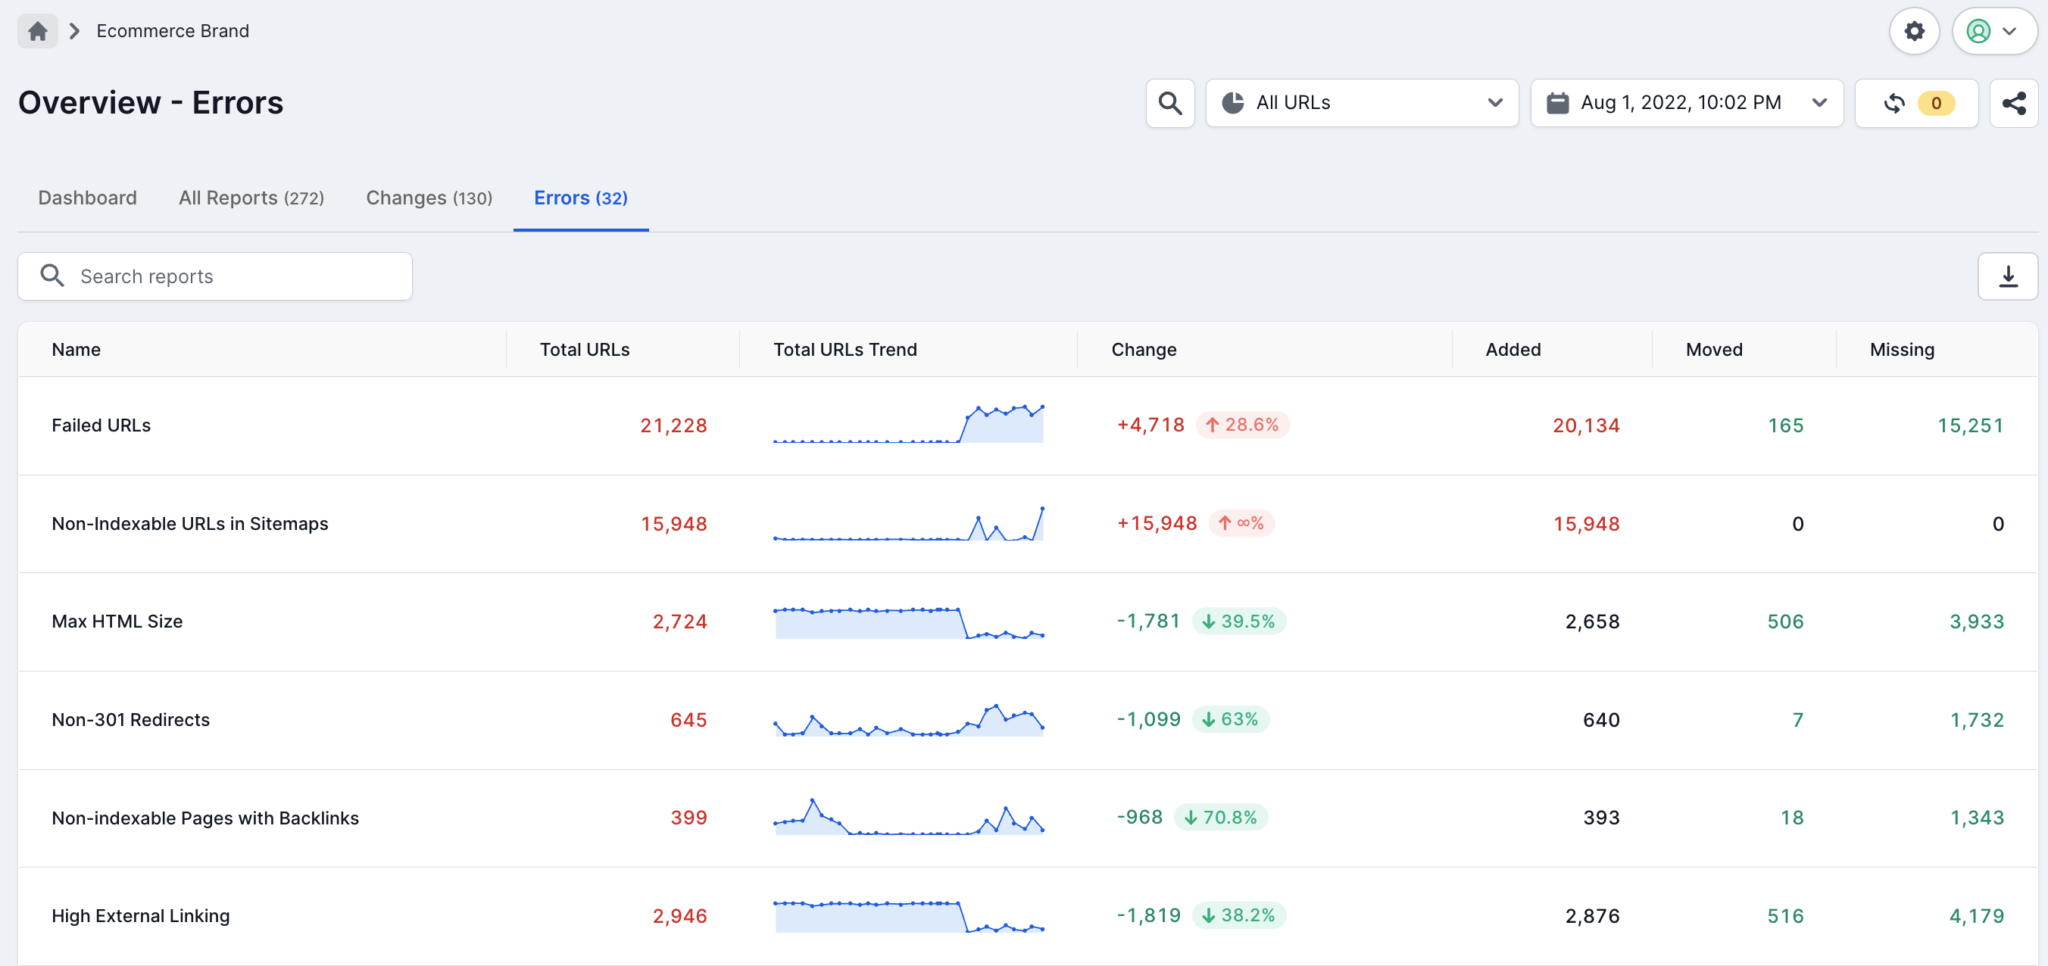
Monitor HTTP Status Codes Report Across All Your Projects
The second page breaks down projects by the number of URLs found in each HTTP status code group. Instead of individually entering projects in the app, you can see how many 200-status, redirect, server error, and broken pages each project has had over the last several crawls. Again, the table at the top shows the most recent crawl vs the previous crawl, while the charts below offer a time series view.
Segmentation Overview Template Pages
The next two pages break down the same reports, but broken down by segment. If you’re wondering, “what is segmentation?” it may not yet be enabled in your Lumar account. Segmentation allows you to divide up your project into smaller datasets. For example, you may have a product pages segment, a category pages segment, and blog page segment. This feature allows you to analyze more specific page groupings in-app.
There are a few things about using Segmentation in the dashboard that can be tricky. Let’s discuss a few of those so that you don’t get caught in a GLS screaming session.
The Three Segmentation Options In The Connector Setup
There are three options for importing data with segmentation:
- No Segmentation – excludes segmentation from pulling into GLS
- Use Segmentation – pulls reports for segments into GLS
- Use Segmentation with All URLs Segment – includes an “All Pages” segment which pulls the “All Pages” reports in addition to the segments into GLS
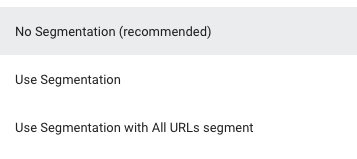
If you use the “Use Segmentation with All URLs Segment” option, you will see an inflated number of URLs, since each of the segments will be counted twice (once as the segment and once in “All Pages”).
Option for Many Projects with Identical Segmentation Setup
If you have many sites with the same page structure, the option to sort by project within the segmentation pages is useful. By naming all of your segments within each project the same thing (example – every project has a “Blog” segment), the template will add the number of pages within each segment for every project. So, at a glance, you can see how many broken Blog pages you have across all of your projects. Then, if you’re interested in a particular project, you can use the project filter to narrow the results to only include segments within that project.
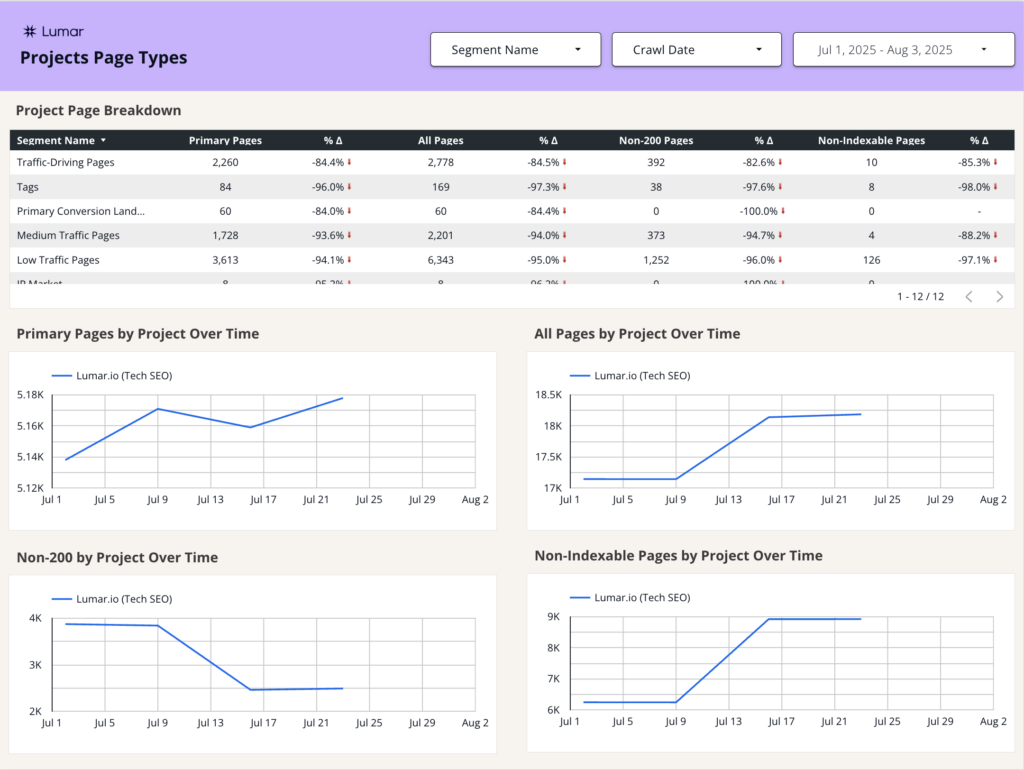
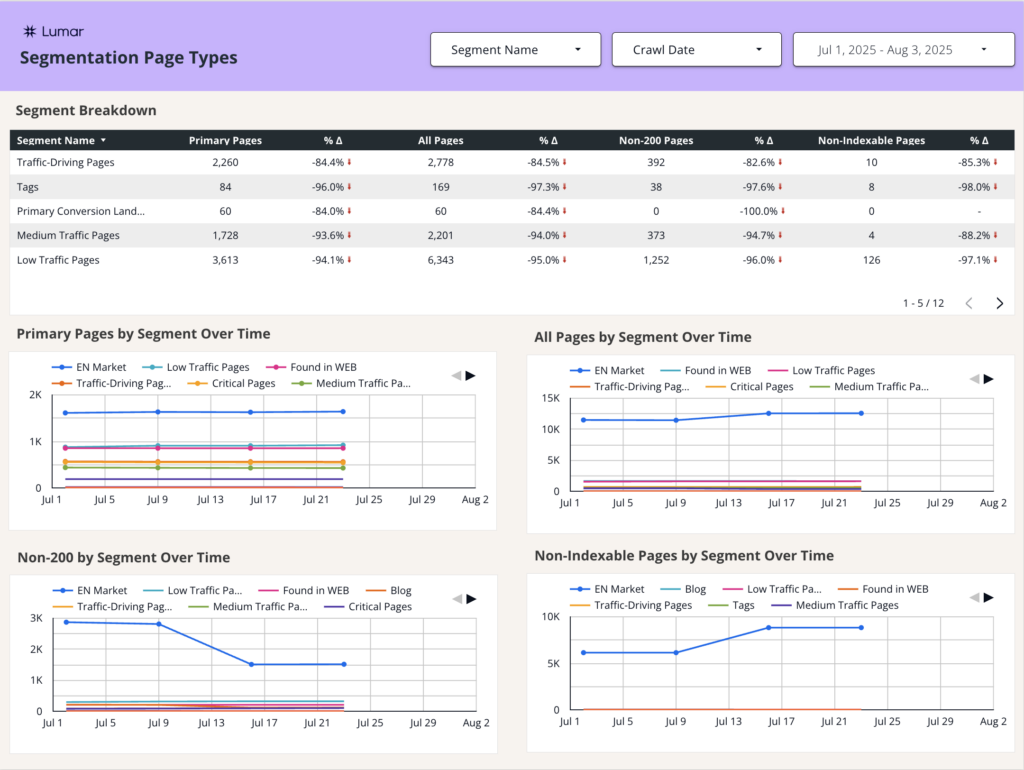
Monitor Page Type Reports Across All Your Segments
The first page shows the number of pages that fit into the categories All Pages, Primary Pages, Duplicate Pages, Paginated 2+ Pages, Mobile Alternates, Non-Indexable Pages, Non-200 Pages, and Failed URLs. This is broken down by segment, which allows you to see changes in specific sections of your site, instead of the entire website. Again, keep in mind that if you decide to include “All Pages” as a segment, the segment report is going to show each segment + an All Pages segment in each report. That’s fine, just remember it if you are trying to total up the pages with problems!
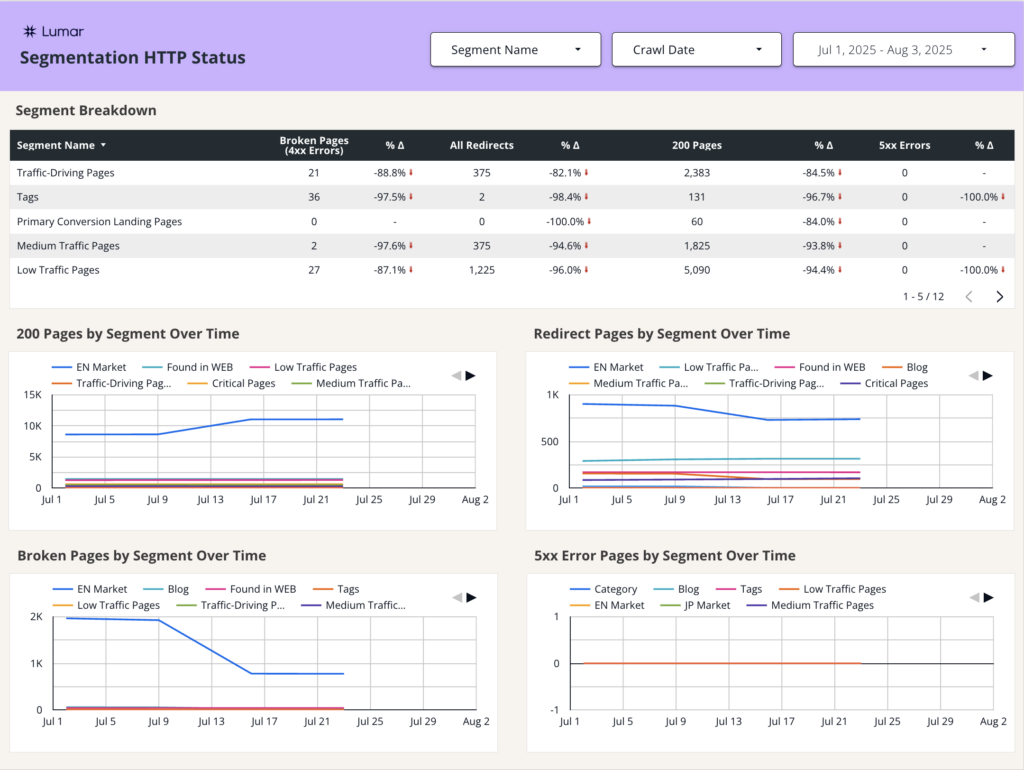
Monitor HTTP Status Code Reports Across All Your Projects
The second page monitors the HTTP status code of segments. In the top table, it compares the most recent crawl to the previous crawl, and the charts at the bottom show the number of pages with 200 Status, Redirect, Broken, and Server Error responses over time, broken down by segments. The warning about All Pages + Segments still applies here!
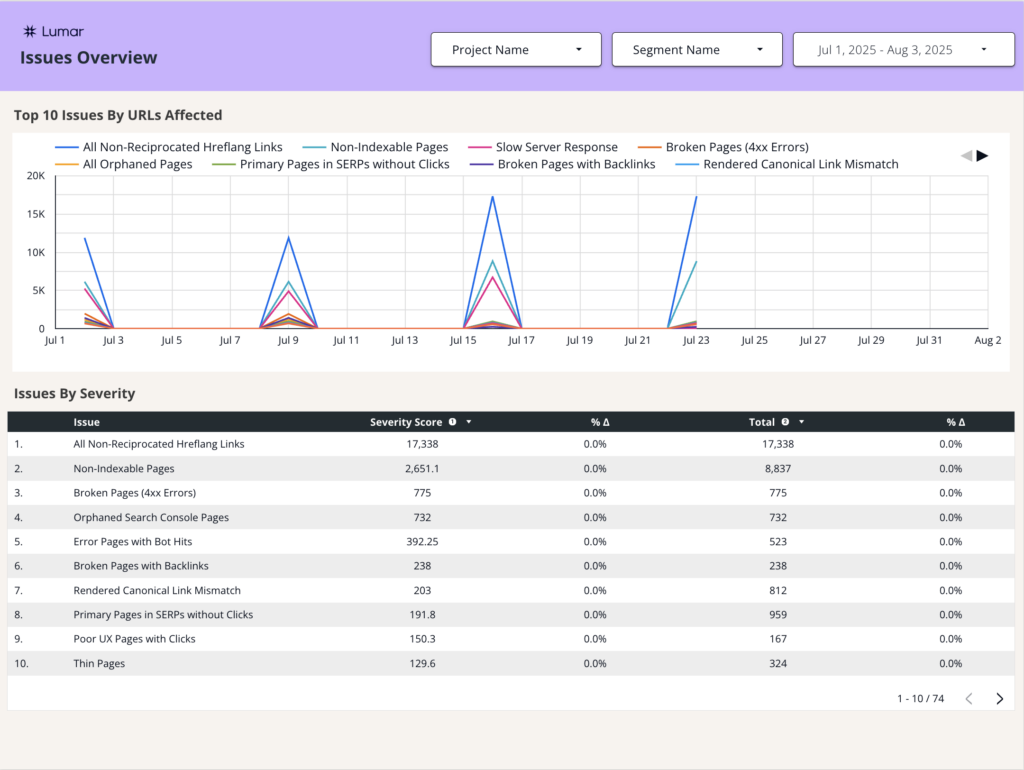
Issues Overview Template Page
In addition to the regular reports from Lumar, the GLS connector has an option to pull in the errors report (see “Issues” data type here).
Because the issues report in Lumar typically highlights many potential issues from a crawl, we narrowed the top chart to the top ten issues, determined by the number of URLs affected.
At the bottom of the page, there’s a table that shows every issue from the app, sorted primarily by the potential severity of the issue, with a secondary sort by the number of URLs affected.
You’ve probably never seen the “severity score” metrics in the app before – it’s what is used in the calculation to determine the priority of issues within the app. All that’s important to know is that higher scores are worse than lower scores, according to the algorithm.
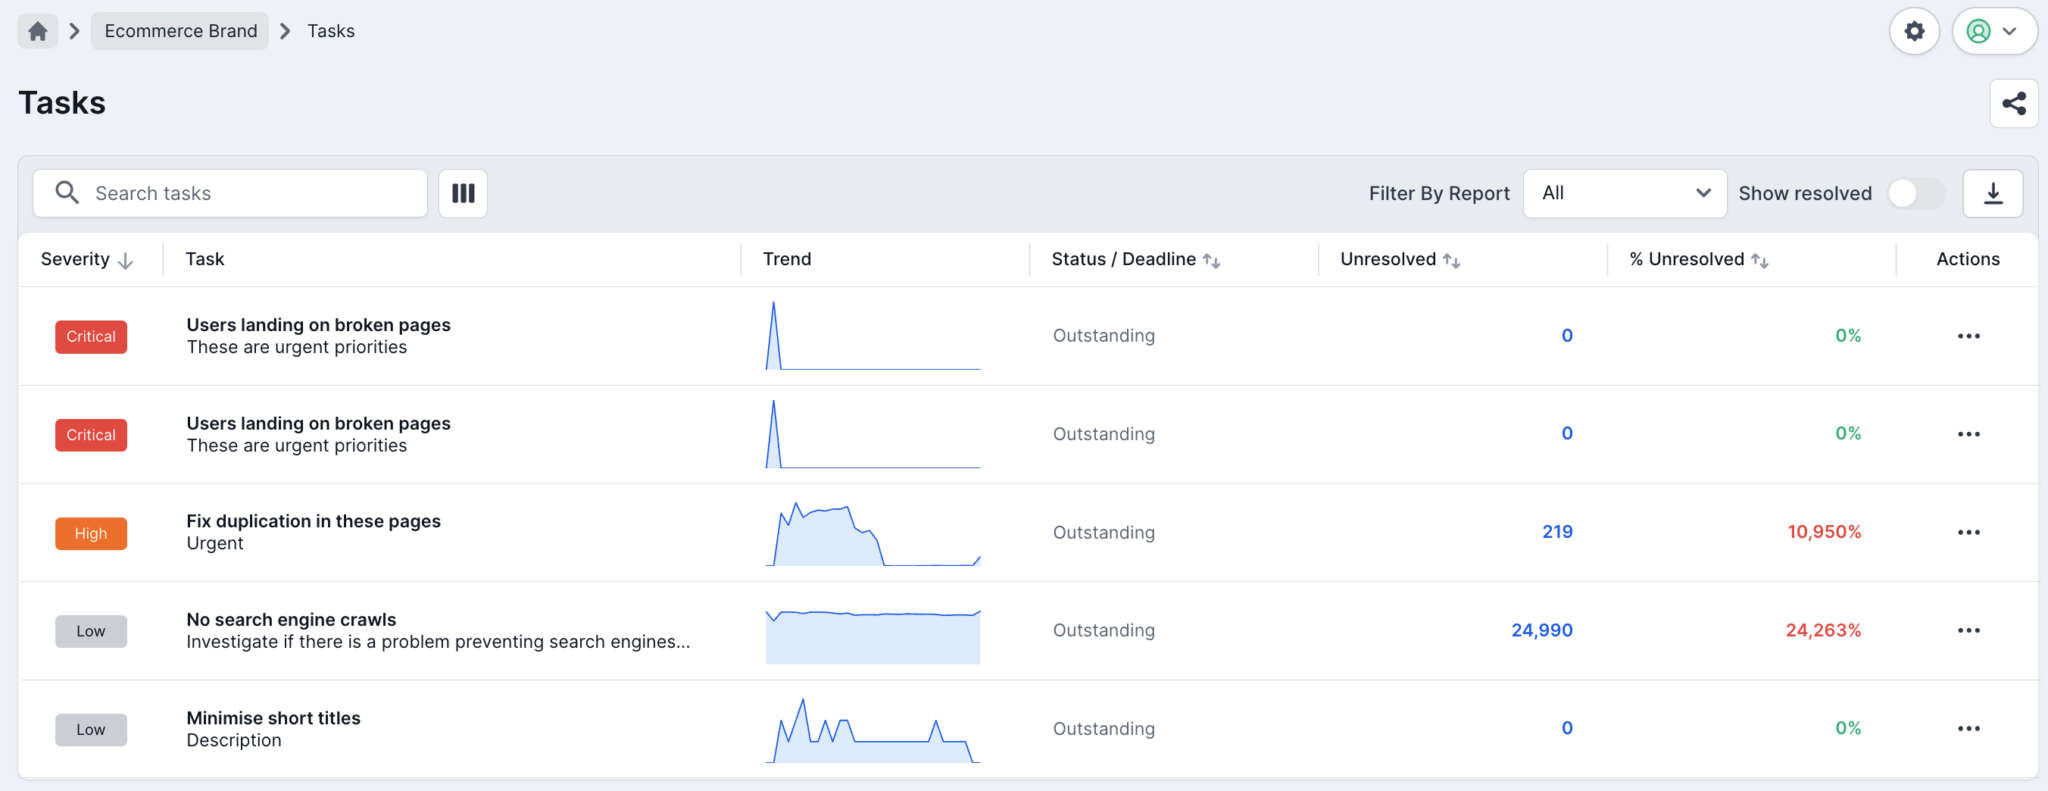
Tasks Overview Page
The connector also has an option to pull in reports from the Lumar Task Manager (see “Tasks” data type here). Any tasks set up within the app can be pulled to this report.
Before I show you around, there are a few things we should define.
What do Identified and Remaining Mean?
“Identified” tasks refer to the number of URLs impacted when the task was created and “remaining” tasks refers to the number of URLs still affected by the issue during the latest crawl.
What is the Tasks Connector “Report” Field?
You may be curious what “report” refers to since many tasks are set up from subsets of data using filters within the app. Report is pulling in the name of the report that was used when originally setting up the report. So, let’s say you navigated to the Broken Pages report, filtered to URLs containing “/product,” and Found in Sitemap is “true.” The “report” listed in the template for this task would be “Broken Pages (4xx Errors)” since that is the report that you built the task off of. If you can’t remember what report you built a task off of, simply visit the Task Manager and click on the task. The app will take you to a filtered version of the report you logged the original task from!
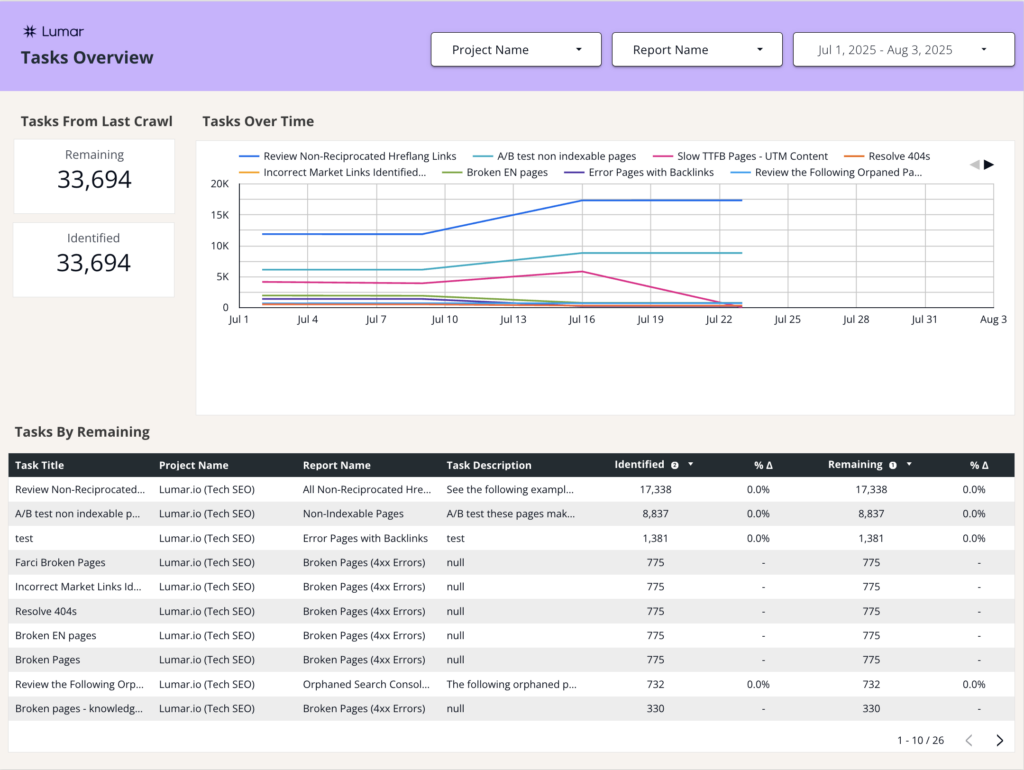
Tasks Overview Template Page
In the template, we are tracking the identified and remaining URLs from the latest crawl vs the previous crawl on the far left.
The chart at the top of the page monitors the remaining URLs impacted by each task over time, while the bottom table lists each task, project, report, identified URLs, and remaining URLs from the latest crawl vs the previous crawl. If you have many tasks set up in your Lumar task manager, you may want to filter the charts by certain projects, reports, or task titles to help simplify this page.
Project Drill Down Reports
The following 5 pages of the template are intended for use with a specific project, though filtering options for segmentation are also available.
Remember that if you pulled in the “All Pages” segment option along with your segments, the default view will show the “All Pages” plus segments, which duplicates the URLs impacted for each segment.
The layout of each remaining template page is similar. The Scorecards at the top show data from the latest crawl vs the previous crawl for each metric listed. The charts on the left show data from the latest crawl from each project only. The chart on the right uses the same metrics as the chart on the left but shows the change over time.
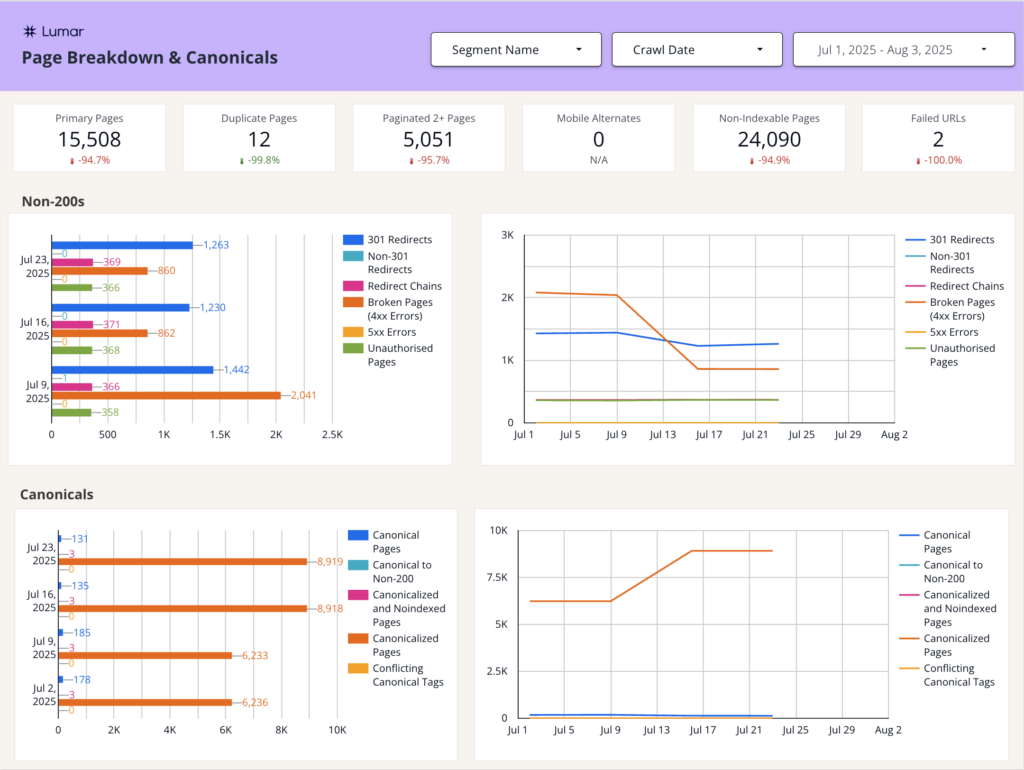
Page Breakdown and Canonicals Template Page
The first page of the Project Drill Down contains a lot of the same information you see in the “Dashboard” page in the Lumar app. The page breakdown, HTTP status breakdown, and canonicals reflect some of the most frequently used in-app technical SEO reports.
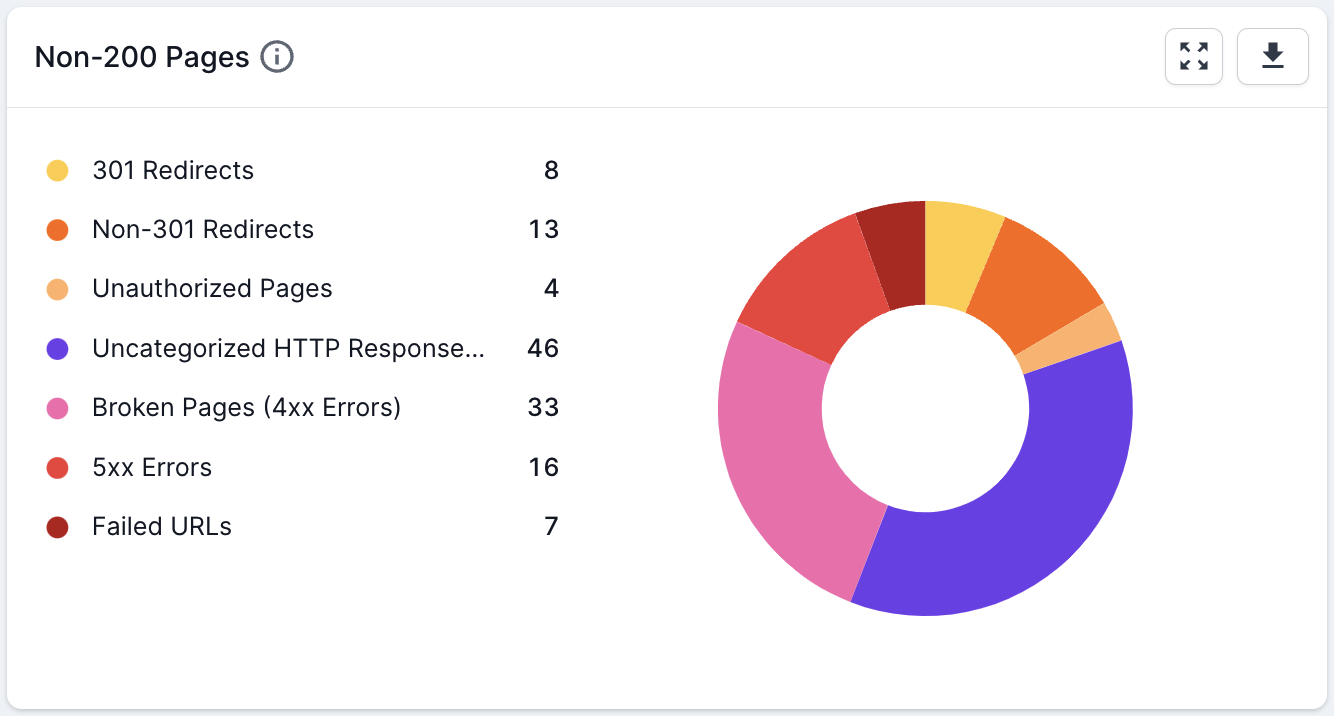
The Non-200 Pages latest crawl chart reflects data from the Non-200 Pages report in the app, but also trends that data over time, without the need to switch between crawl dates, like is necessary in the app.
The canonicals section pulls data about canonicals that is typically found across several reports in the app into two charts – one for the latest crawl data and another for trends over time for each metric.
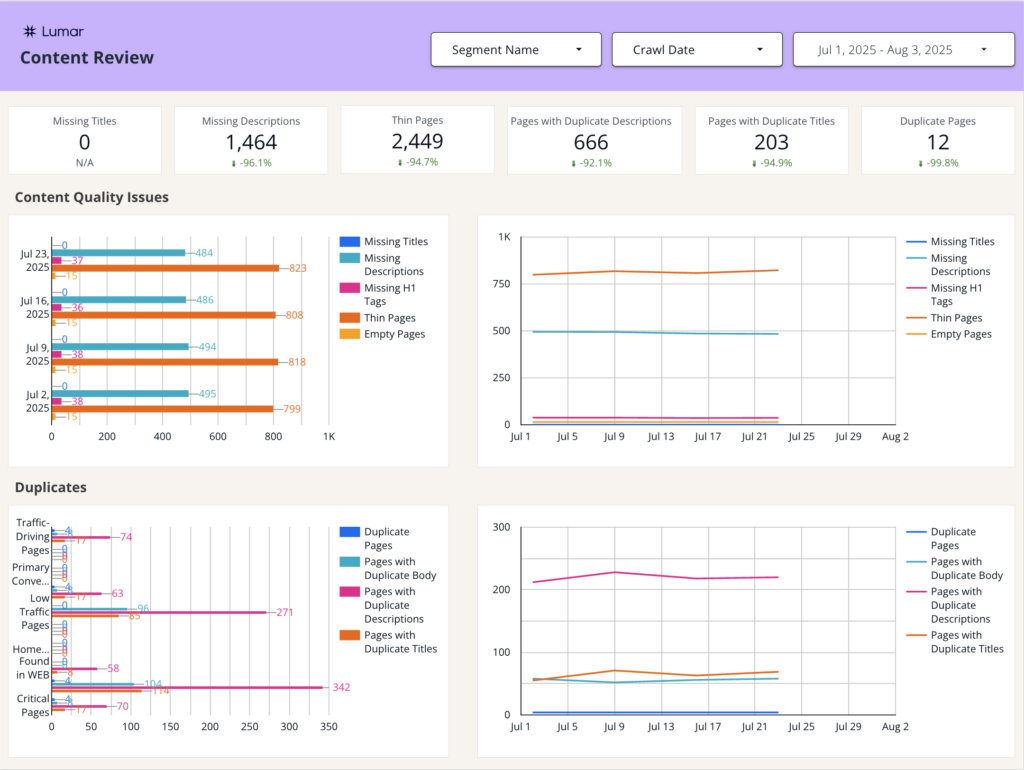
Content Review Template Page
The goal of the content dashboard page is to provide an overview of common content issues found in crawls. For the template, we stuck with missing, thin, and duplicated content issues, but metrics around short and long titles/descriptions and also easily be added in – they’re part of the connector.
For the scorecard charts along the top, we chose a few metrics from the content and duplicate charts below and compared the latest crawl to the previous crawl.
The Content Quality Issues section of the report displays data from the most recent crawl on the left and trends that data over time on the right. If you’re concerned about short and long titles and descriptions, these charts would be a great place to add those metrics.
The duplicates charts track the duplicate pages, duplicate body, duplicate titles, and duplicate descriptions in the latest crawl, as well as over time.
Internal and Backlinks Template Page
Other commonly accessed reports in the app center around internal links and backlinks. Projects using Majestics linking data will populate with backlink reports, otherwise, this section of the template will return 0 for each backlink report.
The scorecards at the top of the dashboard show some of the more critical reports comparing the latest crawl to the previous crawl. The rest of the page is broken down between Internal Links and Backlinks.
Internal links highlights possible linking issues between pages on your site, as well as linking issues from your website to other sites. As with the other pages, this data is visualized with a chart showing the most recent crawl alongside data trending over time.
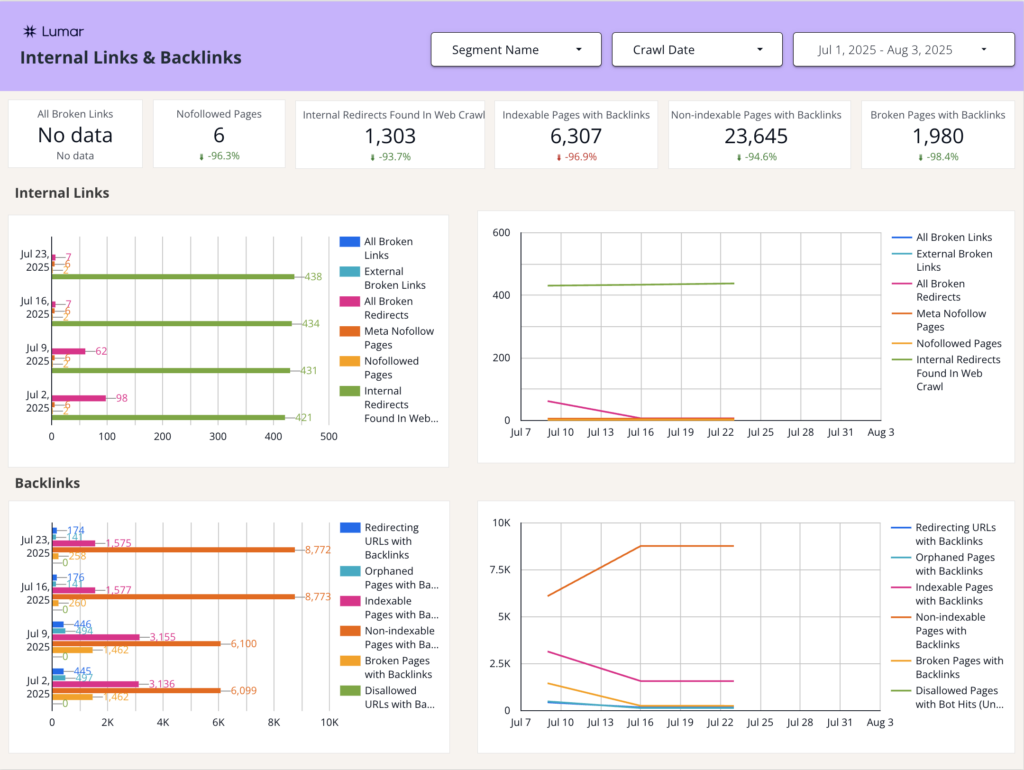
Of course, there are plenty of other reports around linking that can be pulled into the page if these particular reports don’t meet all your needs!
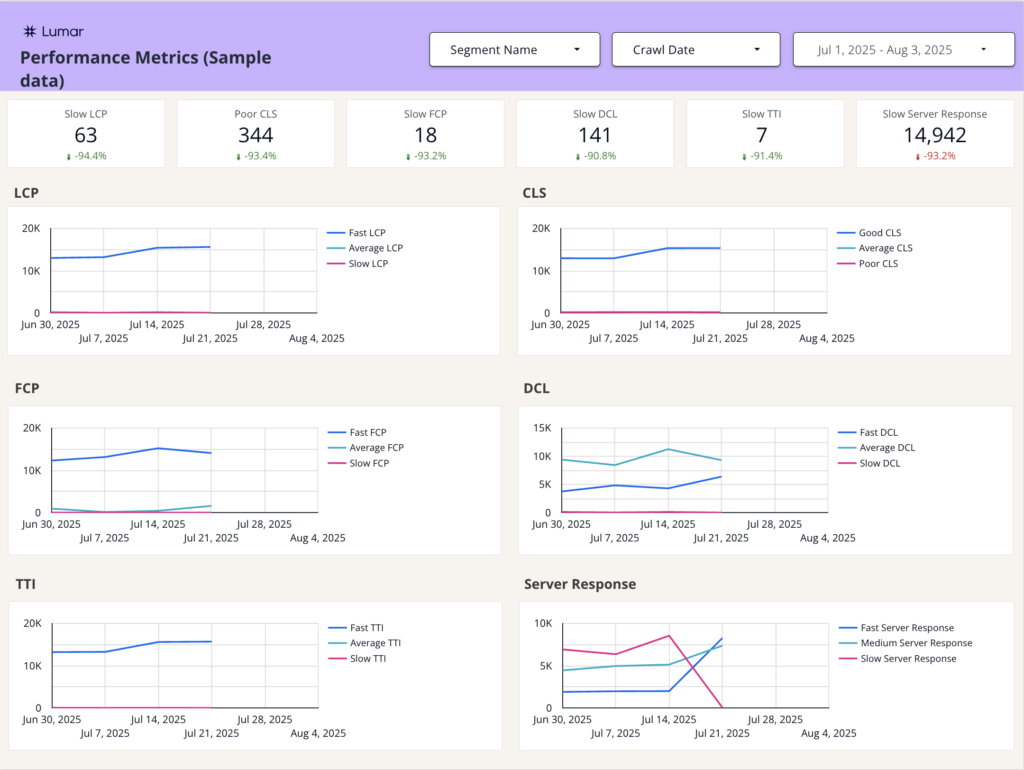
Performance Metrics
Another core area to look at is the performance of your pages. On the performance metrics pages you’ll find trend charts for the following metrics:
- LCP – Largest Contentful Paint measures load performance, or how long it takes for the largest element on a webpage to load.
- CLS – Cumulative Layout Shift quantifies how often and how far elements move around above-the-fold (like content pushed down the page to make room for an advert).
- FCP – First Contentful Pain marks the time at which the first text or image is painted.
- DCL – DOM Content Loaded measures the time it takes for the initial HTML document to be completely loaded and parsed (without CSS, images or JavaScript).
- TTI – Time to Interactive is the amount of time it takes for the page to become fully interactive.
- Server Response – This metric measures the time it takes for the server to respond with the first byte of data for a URL (also known as Time to First Byte or TTFB).
For the metrics above, the template gives you trend lines for each showing Fast, Average and Slow, based on the targets set in Google’s Core Web Vitals. These metrics can be useful to quickly identify trends of degraded performance that should be addressed to maintain or improve the user experience.
Find out more about Core Web Vitals in Lumar.
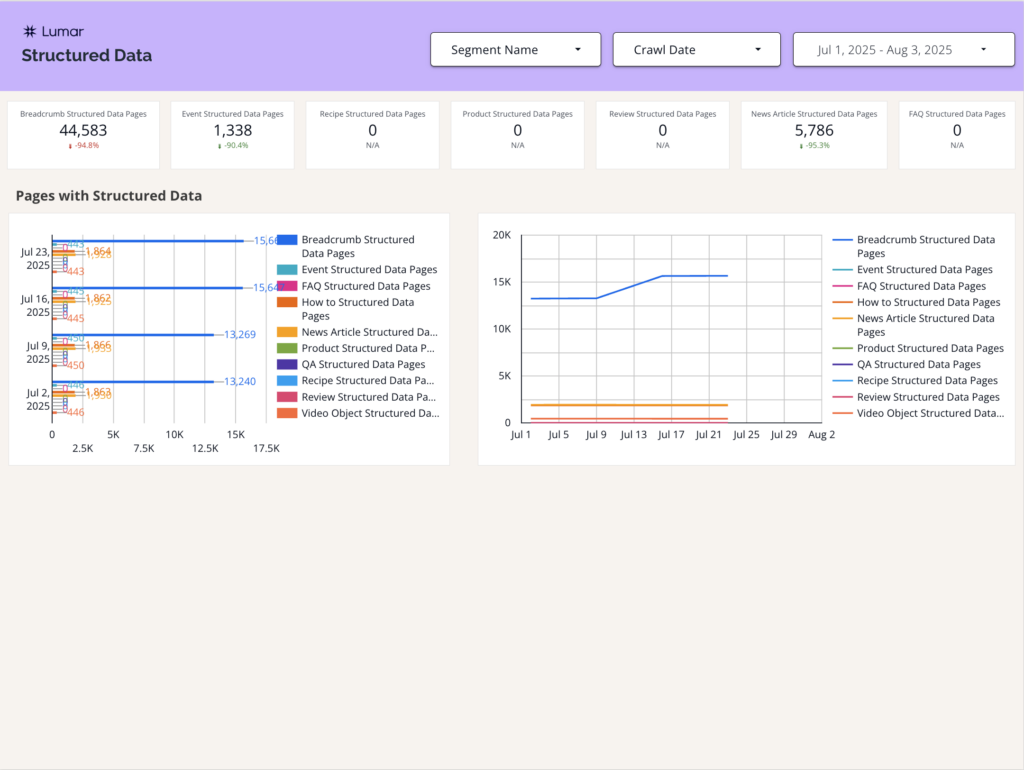
Structured Data
On the Structured Data page of the template, we provide a bar chart showing the number of pages that have structured data. This is broken down into the following Structured Data Pages:
- Breadcrumb
- Event
- FAQ
- How To
- News Article
- Product
- QA
- Recipe
- Review
- Video Object
To the right of the bar chart, we also provide a trend chart so you can look out for any spikes or declines that may need to be investigated.
Find out more about Structured Data in Lumar.
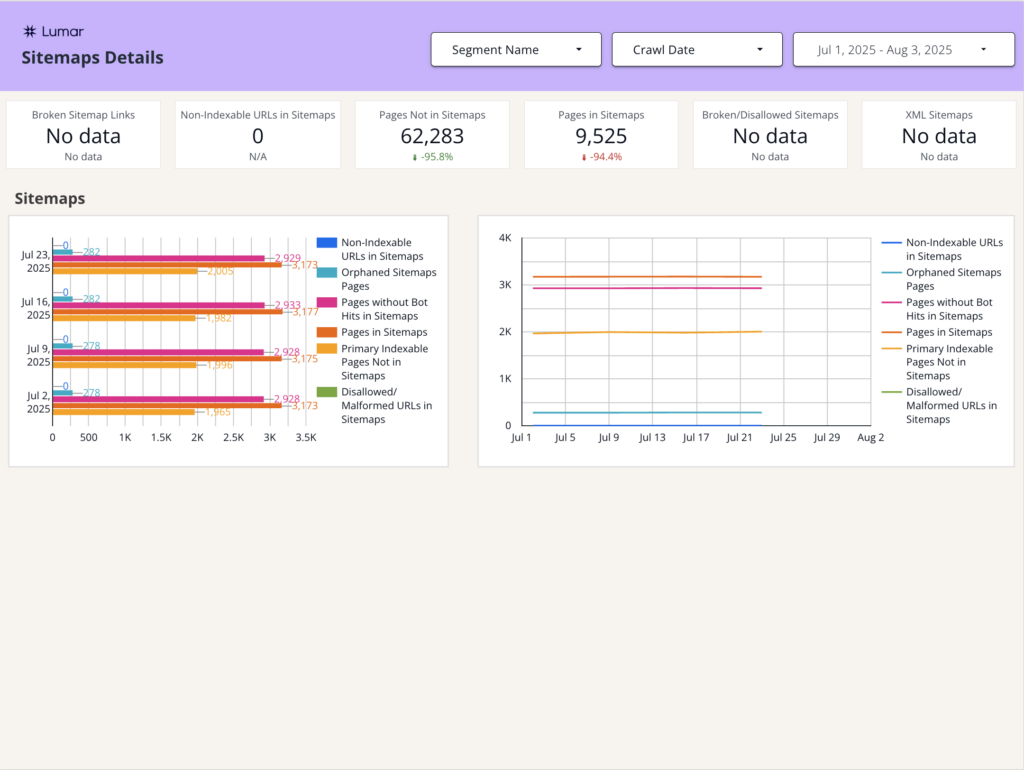
Sitemap Details Template Page
Another common issue is sitemaps that don’t follow best practices. At the top of the sitemaps dashboard page are scorecards with metrics about incorrect pages within sitemaps, pages that may be missing from sitemaps, and information around sitemap.xml files that may be completely broken.
In the charts below, we included additional frequently viewed reports about sitemaps from within the app. As with the other dashboard pages, the left chart shows data from the latest crawl and the right chart shows the same reports trended over time.
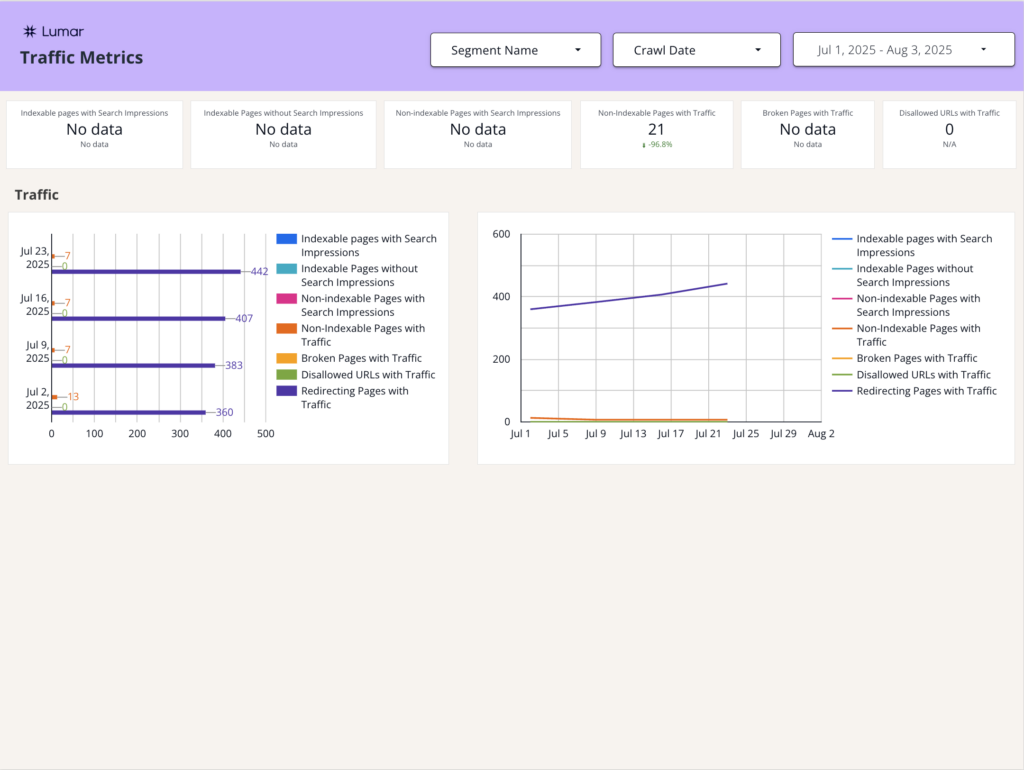
Traffic Metrics Template Page
The final page focuses on traffic reports. Please note that this data is pulled in by connecting your Lumar project with Google Analytics and Google Search Console, so if you do not have this data connected, it will not populate with data.
The scorecards at the top of the page pull in the latest crawl data vs the previous crawl data for many of the traffic reports found in Lumar. These reports are duplicated below to show the latest crawl data in the chart on the left and the URLs affected over time on the right.
Cool, What Else Can I Do?
This template is just the tip of the iceberg when it comes to using Lumar data in Google Looker Studio. Because it’s built in GLS, there are plenty of fun opportunities to bring in data from additional connectors. To get you started, I’ve come up with 7 ways to customize the template to meet your needs.
- If your website uses Hreflang, pull those reports into another page of the dashboard. Or, get crazy and extend the length of the HTTP Status and Canonical Page and put it below.
- Add short/long titles, descriptions to the content page. Make sure these are customized to the levels you are comfortable with using the advanced settings in the app.
- If your project has tasks set up that are specific to reports highlighted on the page, you may want to track those related tasks alongside the other data. By using the “report” field within the task section of the connector, you can filter to only show related tasks.
- Use the Google Search Console GLS Connector for additional data. Pull in total GSC clicks or impressions for the same date ranges using the GSC connector. When fixing issues highlighted in the Lumar reports, do clicks and impressions improve?
- Use the Google Analytics GLS connector for more data. When fixing issues highlighted in the Lumar reports, do organic sessions improve? Does the bounce rate decline? Do conversions go up?
- For the traffic page: If your website is struggling with a particular report (example: Redirecting Pages with Traffic), pull in other Lumar reports around redirects onto the page to keep a closer eye on how redirects may be causing website issues (example reports: 301 Redirects, Redirect Chains, Redirect Loops, Internal Redirects Found in Web Crawl).