Deepcrawl is now Lumar. Read more.
DeepcrawlはLumarになりました。 詳細はこちら

New Traffic Funnel, Health Scores and Benchmarks

Get a snapshot of your site’s technical health in an easy-to-understand format, and benchmark your site against industry averages.

Header image for the health scores, traffic funnel, benchmark and Lumar Impact product guide, showing a screenshot of Lumar Analyze health scores and the traffic funnel.

Our name might have changed from Deepcrawl to Lumar, but our core purpose definitely has not. We have—and always will be—focused on helping our customers achieve the full commercial potential of their website, by helping identify, prioritize and fix website technical health issues fast.

As part of this vision, we’ve introduced new functionality to give a snapshot of your site’s technical health in an easy-to-understand format, with a new traffic funnel and health scores. We’ve also included benchmarks alongside the health scores, so you can see how you compare with industry averages. Watch a quick introduction to this new functionality, and read on to find out more…


The Traffic Funnel

Screenshot of the Lumar traffic funnel in Analyze, showing different stages of the funnel and the number of pages falling out at each stage. The stages start on the left with Availability, and go through Indexability, Uniqueness, Discoverability, Rankability, and finally Experience on the right hand side.
Lumar’s new Traffic Funnel

The new traffic funnel shows how many of your pages are making it all the way from availability, to driving traffic with a good user experience. More importantly, it shows how many pages are dropping out of the funnel at each stage, and therefore unlikely to be driving conversions. 

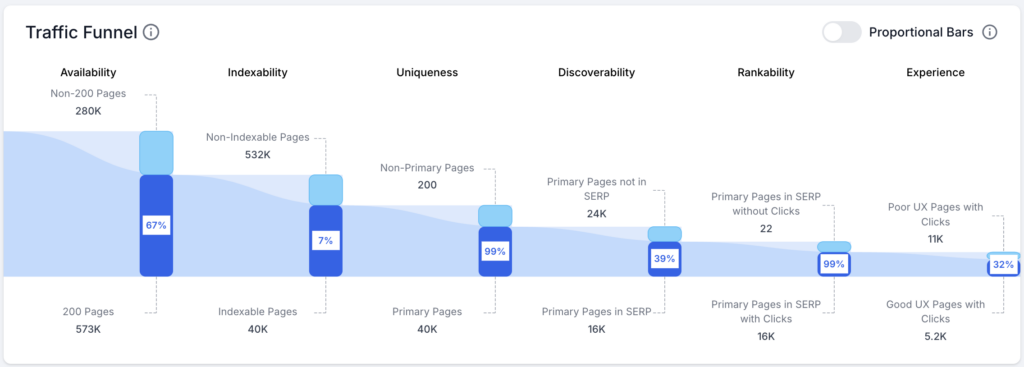
At the top end of the funnel, we look at the ability for search engines to find, index and present your pages to Google’s Search Engine Results Pages (SERP). At the bottom end, we look at the effectiveness of pages appearing in SERP to drive visits and conversions. 

  • Availability – How many of your pages are available to search engines? 
  • Indexability – Can search engines index your pages?
  • Uniqueness – How much of your content is not duplicated elsewhere on your site?
  • Discoverability – How many of your pages are in Google’s search engine results pages?
  • Rankability – Of the pages appearing in SERP, how many are actually driving visits? 
  • Experience – How many of your traffic-driving delivering a great user experience, and therefore likely to convert? 

Proportional Bars Mode

By default, the traffic funnel will be proportional to the number of pages dropping out of the funnel. Depending on the percentage of drop-off, you may find that the right hand side of the funnel is slightly obscured. If that’s the case, toggling off ‘Proportional’ mode will resize the funnel to fixed heights so you can clearly see the detail.

Can’t See the Traffic Funnel? 

In order to show the traffic funnel, Google Search Console needs to be connected to Lumar (find out how to connect Google Search Console to Lumar). Web Crawl, Search Console and JavaScript Rendering must then be included in the crawl settings to collect the data required for the traffic funnel, which will be available once the next crawl completes. See the Getting Started section below for more details.


Health Scores

Screenshot of Lumar Analyze Health Scores, showing the overall health score of 82 out of 100, and top health score errors. It also shows individual health scores for availability, indexability, uniqueness, discoverability, rankability and experience.
Lumar Impact – Health Scores

The health scores provide a mark out of 100 for specific areas of your website’s technical health, aligned to the traffic funnel. This helps you identify key areas for investigation to drive improvements and increase conversions. At the top of the screen you’ll see your site’s overall health score, which is made up of the health scores for the traffic funnel categories below. 

Some of these categories also have subcategories, allowing you to drill down into the relevant section to diagnose issues quickly. Availability and Uniqueness do not have subcategories, but for the remaining categories, the subcategories are:

Indexability:
– Non-Indexable
– Canonicalization
– Mobile Indexability

Rankability:
– Search Console
– Authority
– Page Content
– Structured Data
– Social Tags
Discoverability:
– Crawl Budget
– Internal Linking
– Redirection
– Sitemaps
– Internationalization
Experience:
– Page Speed
– Engagement
– User Experience
– Security
– External Links

How the Health Scores are Calculated

Health scores are calculated from Lumar reports which are considered to be errors. 

All scores start at 100 and the errors are deducted to form a final score. If there are too many errors, the health score may show a value of 0 and, conversely, if no errors are found then the health score will be 100. 

We measure each error report as a percentage of its scope.  For example, the scope of the Duplicate Pages report would be indexable pages, as a duplicate page that is not indexable would not be an issue.

Each report is assigned a weight which determines its contribution to the health score of the category to which it belongs. The health score of a parent category is calculated from the child category’s health scores, weighted by the sum of weights of all reports within the child category. Each category then contributes to the overall health score based on the weight of reports within the category.

Health Score Errors

At the top of the dashboard for the project overview and each category or subcategory, you’ll see the health score for that section. To the right of the health score, you’ll then see a list of Health Score Errors that are impacting your score, with the most impactful being at the top. This helps guide you to the areas that will have the most effect for each stage of the traffic funnel.

Google Analytics Data

Some scores (for example the Engagement scores) rely on Google Analytics data being available. If you see a “N/A” value for a particular score, this means Google Analytics isn’t connected to Lumar (you can see here for how to connect your Google Analytics account to Lumar). N/A values won’t count towards your overall health score. However, once you add the source needed, your overall health score will likely change to reflect the new data that has been added. 

Health Scores for Previous Crawls

To enable the health scores and traffic funnel, we’ve built more than 30 new reports in the Lumar platform (find out more about the new Lumar reports). As these reports didn’t exist when previous crawls were run, we’re unable to show the funnel and health scores for crawls that were completed prior to 28th September, 2022. All crawls from that date will enable the new reports, and therefore the health scores.


Industry Benchmarks

Screenshot of industry benchmarks in Lumar Impact. This shows the trend line of the overall health score for a particular site, reaching 84 out of 100 in the latest crawl (from a starting point of around 55 30 crawls ago). It also shows the industry benchmark across all industries at a health score of 25.
Lumar Impact – Benchmarks

Alongside the health scores, you can also see how your site compares to industry benchmarks. These are created from monthly crawls of a variety of different websites. These crawls are then aggregated to create an average across ‘All Industries’. The selection of websites being crawled includes sites from specific industries which are used to create the following industry benchmark scores:

  • Communications
  • E-commerce
  • Fashion & Apparel
  • Financial Services
  • Manufacturing
  • Publishing 
  • SaaS
  • Technology

Now I know the question you’re dying to ask. But, to maintain confidentiality, we cannot disclose the specific websites included in the benchmark crawls. We use our industry expertise and experience to calculate a benchmark and use representative industry-specific data to create them. 

See the Getting Started section below for how to select the industry benchmark for each of your projects.


Lumar Impact

Impact has been designed to provide Digital Leaders (such as digital marketers, growth leaders, product managers, etc.) with the traffic funnel, health scores and benchmarking in a separate app, allowing them to focus on the high-level information so they can quickly see how things are progressing, and identify opportunities for growth.

We’ve launched this initial version of Impact to give Digital Leaders a first look at the type of information we can provide them. Over the next couple of months we’ll be working with our design partners to identify additional functionality for Impact, and we’re excited to see where it can add even more value.


Who is the New Functionality For?

The new functionality is targeted at enterprise businesses with large websites. The sheer volume of technical health data captured from a site can be overwhelming, so having an easy-to-understand view of overall health is vital to effectively prioritizing and fixing issues, and identifying the greatest opportunities for growth. 

Technical SEOs

A common challenge for Technical SEOs is communicating the importance of technical website health, and getting improvements prioritized against wider business goals. Tech SEO leaders often spend a lot of time building reports to show the value of the teams’ work, and educate the business on modern technical health best practices. 

The Impact functionality simplifies reporting for Tech SEOs, showing technical health in an easy-to-understand way and translating metrics into wider business KPIs. This helps secure resources and get work prioritized, by showing the business the true value of improvements and driving technical website health as a business priority.

Digital Leaders

In our conversations with Digital Leaders, many commented that it’s difficult to get a quick snapshot of their site’s technical health, instead relying on teams providing regular updates which is time consuming for those creating the reports. The Impact app therefore gives them access to the information they need, as well as providing a way to track progress and giving commonly accepted metrics to improve alignment across teams. 

Digital Leaders also wanted to get an idea of how their site compares to others in their industry. With the industry benchmarks, you can see how your site compares in different areas of the traffic funnel, to again help identify opportunities for growth. 

The combination of traffic funnel, health scores and benchmarks also provides key information in an easy-to-understand format, which can help communicate issues and progress, and secure buy-in and resources for improvements.


Getting Started

To add the new functionality to your subscription, contact your Customer Support Manager or get in touch here. If you’re not a customer yet, you can request a demo here.

To enable the traffic funnel, you need to make sure that your Google Search Console account is connected to Lumar. We also recommend connecting your Google Analytics account, as well as including Sitemaps and Log Files integration, so you can see all of the health scores (see the health scores section above for more detail). 

Now you’re ready to get started:

  1. Access your project, and click Project Settings in the top left corner of the screen.
Screenshot of Lumar overview dashboard for a specific project, with the project settings option highlighted.
  1. In Step 1, make sure the ‘Enable JavaScript rendering’ option is checked. 
  2. To enable the benchmarks, you can select the relevant industry or ‘All Industries’ using the drop down. Then click Save and continue.
Screenshot of the Lumar Analyze project settings step 1, with the option to choose an industry for benchmarking and 'enable JavaScript rendering' options highlighted.
  1. In Step 2 of project settings, make sure the Google Search Console and Analytics are checked. We also recommend enabling Sitemaps, Backlinks and Log Files for the most accurate health scores. Again, click save and continue.
Screenshot of Lumar Analyze project settings step 2 showing the sources that can be included in a crawl. In this example, website, sitemaps, backlinks, Google Search Console, Analytics and Log Summary are highlighted. URL lists is also shown as another option.
  1. You can now move ahead to the 4th stage of project settings and start a crawl. Or you can wait until the next scheduled crawl runs. 
  2. Once the crawl is complete, you’ll then see the traffic funnel and health scores with benchmarks for your project. If you want to revert to the old layout, just toggle off the ‘Try new categorization’ option.
Screenshot of the overview dashboard for a particular project, highlighting the 'try new categorization' toggle that allowed users to switch between the old categorization and the new categorization that enables the health scores and traffic funnel.
  1. Don’t forget to give us your feedback! Just click on the smiley face at the bottom of the screen.
This image is a short animation showing how to leave feedback in the Lumar app. In the bottom left hand corner, users can click on the smiling face icon, choose a rating for their experience from hate, dislike, neutral, like or love, and then type in their feedback.
Avatar image for Andrew Levey
Andrew Levey

Andrew heads up Product Marketing at Lumar, and is enthusiastic about helping prospects and clients understand the value of—and get the most out of—the Lumar platform. Outside of work, he likes great TV and film, is a bit of an amateur photographer and sings with the London Gay Men's Chorus.

Newsletter

Get the best digital marketing & SEO insights, straight to your inbox