

For our latest DeepCrawl webinar, we were very excited to welcome Jill Quick, Cofounder of The Coloring In Department. Joining our host, DeepCrawl’s CAB Chairman, Jon Myers, Jill shared some key themes that she has found in teaching, troubleshooting and training all things Google Analytics over the last decade. She explored how to use admin settings to unlock cleaner data, the need for clear conversion setup in GA, as well as how to build advanced custom segments. Along with this, Jill shared her ideas on how to use content groupings beyond Content Behavior Reports, as well as how to apply these content groupings to Data Studio to use with DeepCrawl data.
We’d like to say a big thank you to Jill for her great presentation and for taking the time to share her knowledge and experience with us, as well as to Jon for hosting, and all those who attended.
You can watch the full recording here:
The importance of data
Jill introduced her webinar with her favourite quote: ‘Without data, you’re just another person with an opinion.’ She explained that in order to secure a budget it is important to have numbers to back up your ideas. It is therefore imperative that the numbers you are reporting on from Google Analytics are correct, otherwise you risk making bad decisions.

Tinkering with your Google Analytics Settings
Understanding how the cogs of Google Analytics function can provide a lot of value to your analytical work. One place to start is with filters; while the concept of filters is fairly simple, they can be incredibly powerful when it comes to cleaning up your data. Filters provide the ability to include, exclude or modify data and can help you to understand why the data you are collecting may be doing things in a certain way. Also known as View Filters, these differ from report-level filtering, and instead are set up in Admin Settings, permanently filtering the data that Google Analytics sends to the reports.
When first working with filters, it can be helpful to group them into themes, with the first theme allowing you to see the right people. For example, this could include ensuring visits from internal staff members are excluded by using IP filters, as well as development and staging sites. Because filters permanently filter the data, it can be useful to create a new view for each theme-based filter. Jill explained that she once worked with a client who had over 20 staging environments which were all sending traffic to the website and therefore massively inflating the data found in Google Analytics. This, in turn, can dilute the conversion rates and provide incorrect information.
Another filter to include here is cross-domain tracking, to allow any subdomains you may have to be tracked in one simultaneous Google Analytics account. This enables you to see and understand the whole ecosystem of your website. It also allows you to display the benefits of your SEO efforts, for example, if you provide the ability to buy a product on a separate subdomain from the one at the top of the funnel. By tracking this within GA you will be able to see this whole journey.

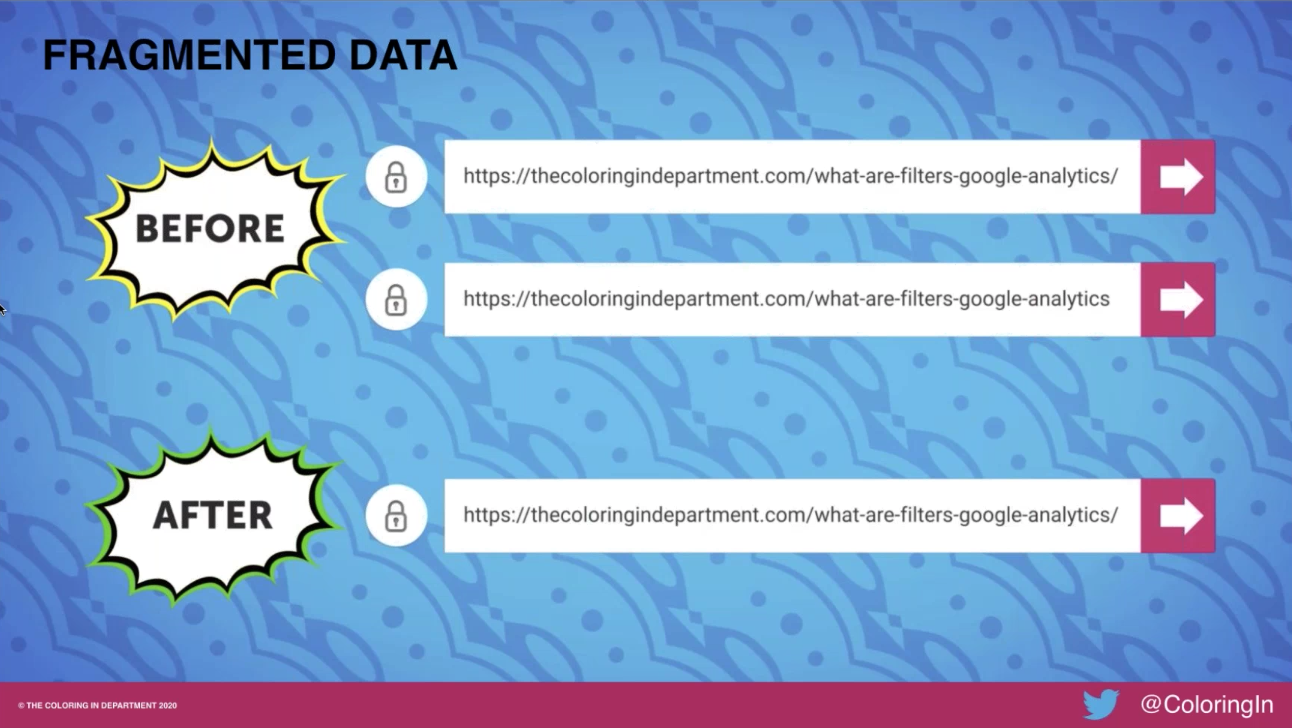
The second theme that Jill looked at is seeing the right content. For example, if you have the same URL with and without a trailing slash, while the user may still be linked to the intended page, Google Analytics will view this as two separate pages. As this will fragment your data, it’s important to include a filter to consolidate this data when looking at your content reports.
Another culprit for fragmenting data is having search terms included in your URL. While it’s important to report on the search terms visitors are using on your site, to prevent these from being recorded as a page in your URL reports and fragmenting your data further, you can set up filters to exclude the query parameters.
The third theme Jill recommends is seeing the right reports, this is where you can use a filter to modify the data. For example, if you have URLs set up which include several random numbers or letters, Jill recommends adding a filter that can modify this within Google Analytics to make it easier to view and report on these pages. This will not change the URLs being used on the site, but can make it easier to review the data, once it has been collected in GA.
Data Retention in Google Analytics
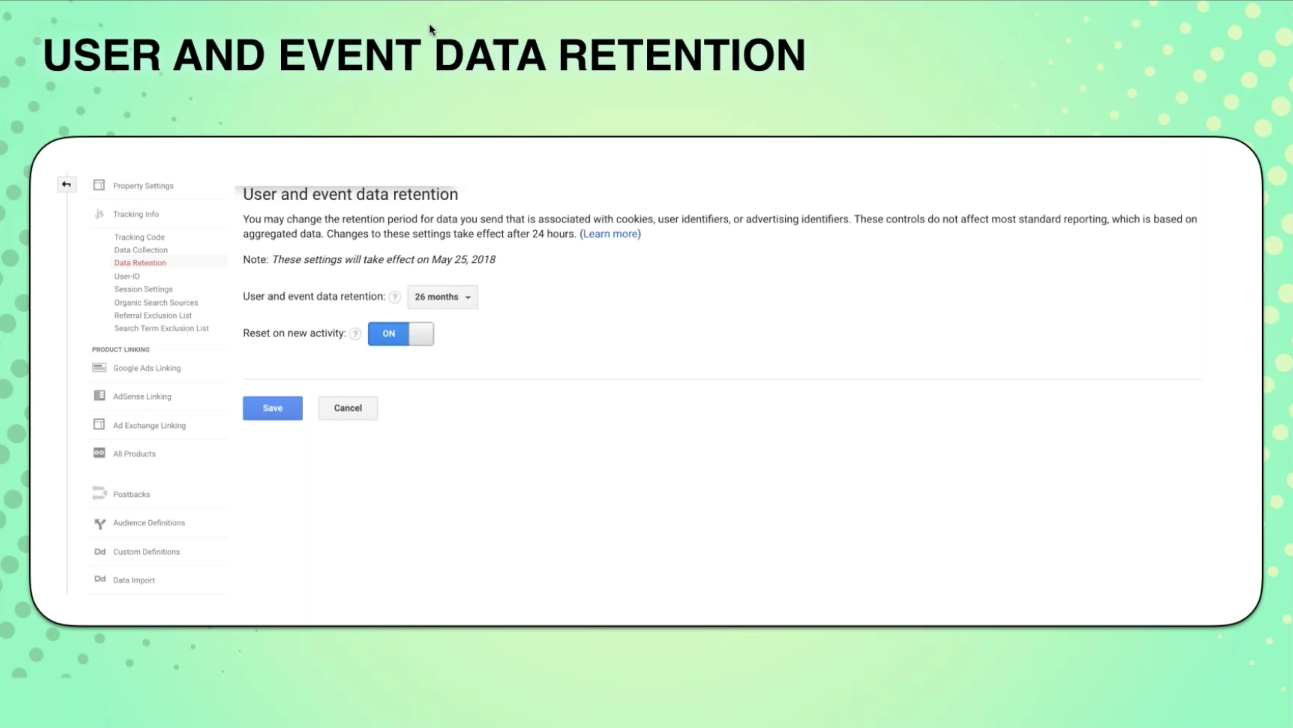
Data retention is a big part of Google Analytics, and user and event data retention is typically set to 26 months, unless you manually change it. This means that any data that was collected before this time has been deleted from your account.
Therefore, when performing historical data analysis to review the gains and losses over time, it’s important to review the data retention settings before building out your report. This will give you an understanding of the amount of data you will be able to view.
Setting Goals in Google Analytics
As marketers, our goal is to generate revenue and attribution to some sort of profitable customer interaction. Regardless of your business model, our job is to drive growth or retain customers. However, when reporting on these goals, we are often only including macro goals within Google Analytics, and therefore neglecting the important micro goals.
It’s important to track both of these because there is a lot that can happen between somebody landing on your website and then actually taking the desired action, the action which would be considered a macro goal.
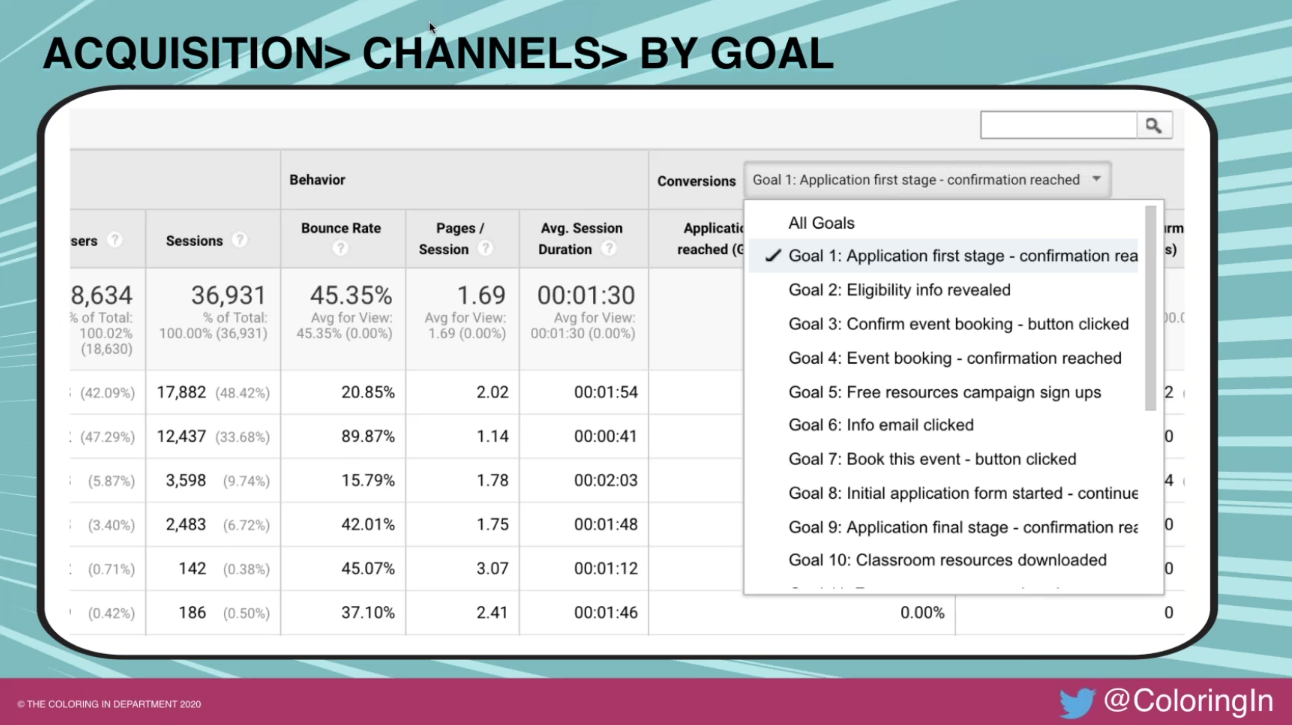
GA allows you to set up 20 goals per reporting view, and Jill recommends making the most of all of these. When setting goals up, Jill starts by walking through the typical user journey and considers all of the actions they could be taking on the site as they edge closer to performing the desired action. For example this could be:
- Reading a case study
- Watching a video
- Registering for a webinar
- Listening to a podcast
- Downloading a whitepaper
- Reading a blog post
- Sharing content from the website
These are important micro conversions. The value of having all of these micro and macro conversions together is that it provides the ability to stitch together the data with the customer journey, in order to understand the role each of your marketing channels have for your particular strategy. This enables you to drill down and review the conversion rate for each individual micro and macro goal.
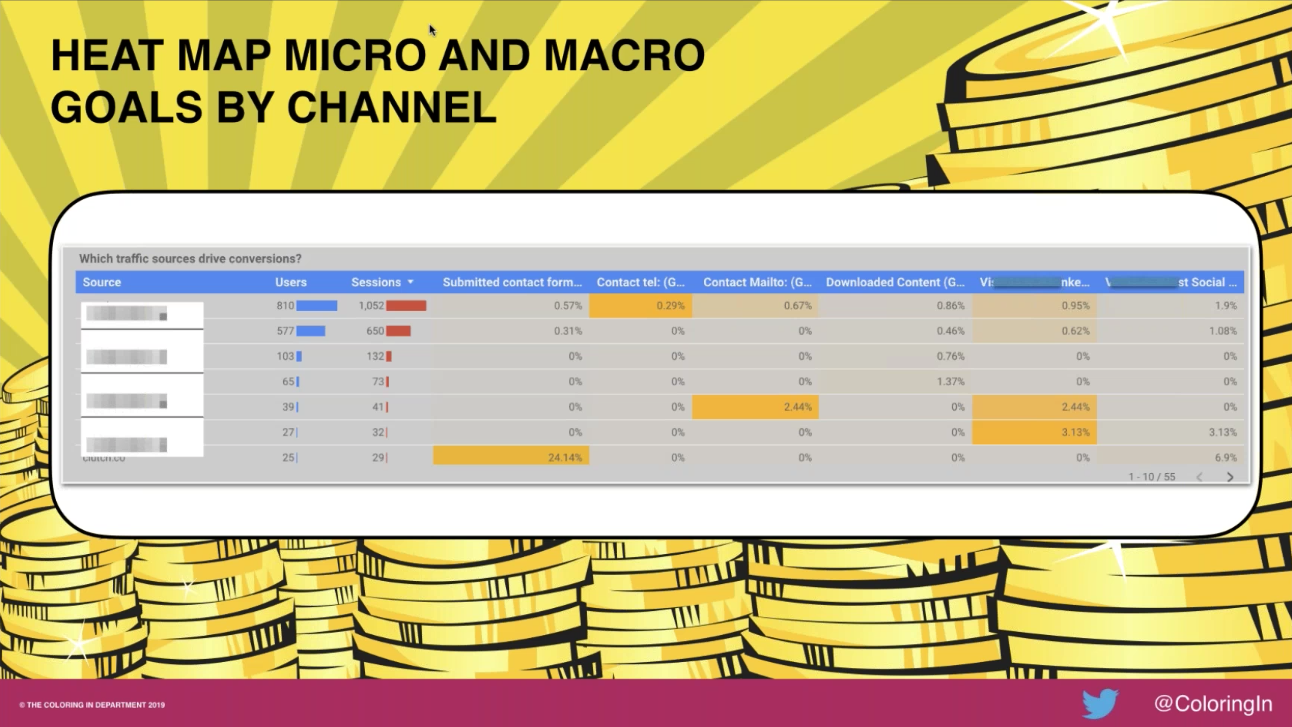
You can then take this further and visualise the data using Google Data Studio, to heat map these goals to the source, medium or source/medium. This allows you to visually show the role of each individual channel.
Google Analytics Segments
When looking at all of your data from Google Analytics, you are given the average for the particular data set you are reviewing. It doesn’t show you what is doing really well, places which are struggling or your top converters. This is where segments can provide real value, to help you understand how different users are interacting with your site, as well as review your top-performing content.
When it comes to segmenting data, you have the option of selecting the user segments or the session segments. The data that is returned will differ depending on which one you select. For example, if you select the user-based segments you are asking Google Analytics to show you all of the sessions related to a user and all of the interactions they had on the site.
However, if you select session segments, you are telling Google Analytics to show you all of the sessions of a certain type; it is therefore only going to look through the dataset of the last session that matches those parameters. An important distinction being that a given user may have multiple sessions, and they may originate from different channels or entrance URLs. If there are any conversions from this, a session segment is only going to look at the last session that the user converted from.
When creating segments it is therefore important to be mindful of whether this should be session- or user-based.

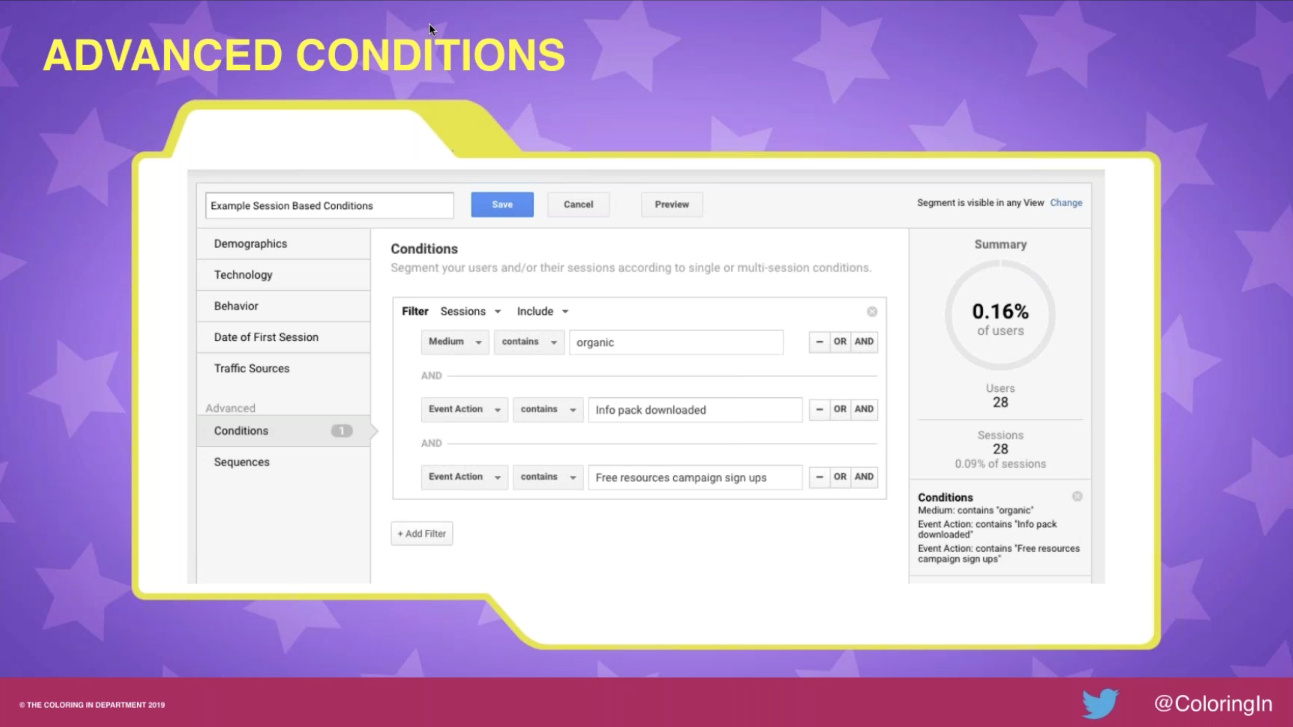
Google Analytics Conditions and Sequences
When building advanced segments, Google Analytics gives you the option to include conditions and sequences. The difference between these is that with conditions you are looking at the specific set of actions a user is completing, however with sequences you are saying they must have done these particular actions in a specific order.
These advanced conditions allow you to build detailed segments, looking at what your users are doing on the website, to gain richer insights and help with optimisation activities.
Gaining Content Insights
It can be difficult to gain useful insights from the data you are collecting in Google Analytics when looking through several reports which contain a lot of information. These real insights are only going to be seen once you have a cleaner view of the data.
One way of doing this is by using Content Groupings. These groupings will allow you to categorise the content based on a set of rules, which will enable you to see all the data for particular categories. This will in turn show you all of the URLs that you associate to that particular content group, and Google allows you to set up 5 of these per reporting view.
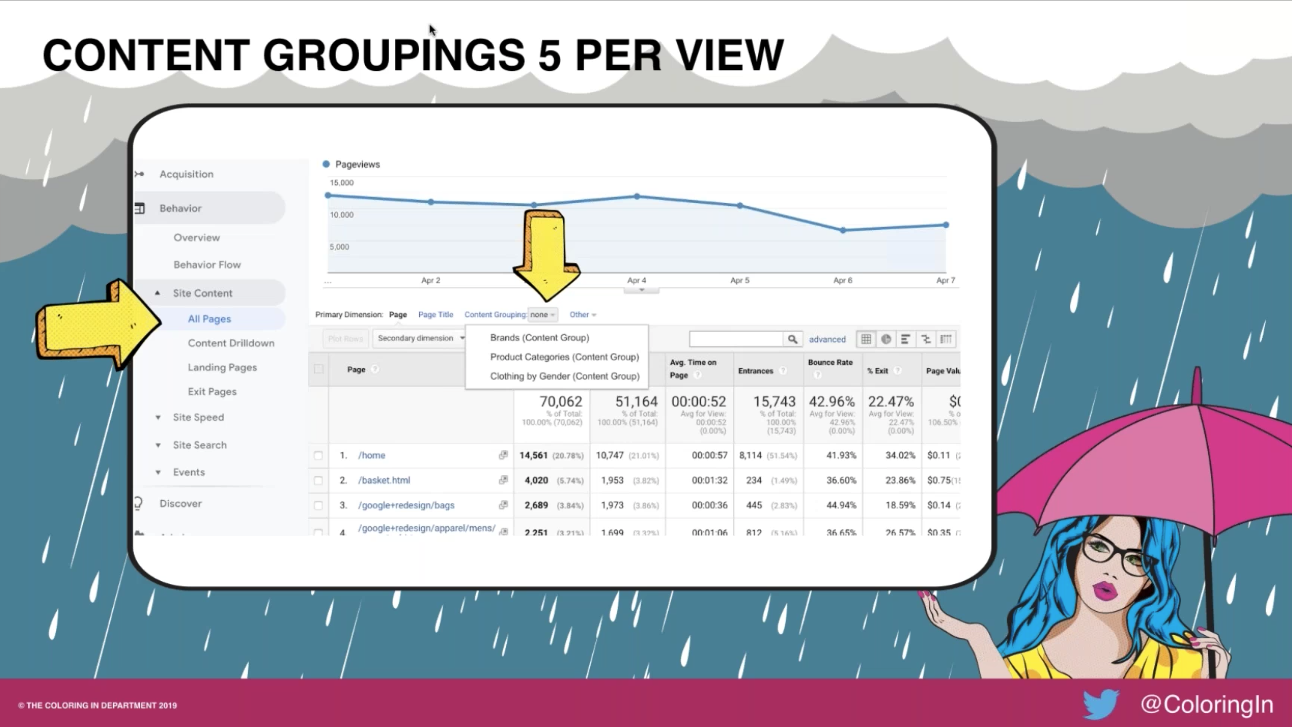
A really useful feature of these Content Groupings is that you are able to use them beyond your site content and pages reports. For example, you can use them as secondary dimensions to gain a better understanding of the type of content users are interested in, based on the channel they arrived to the site from, or pages they had previously viewed. You can also use them as advanced segments, and even to build remarketing lists.
Content Groupings can be built using a set of rules e.g. if the URL contains a certain word, then it will be put in a certain group, as well as content via extractions using regex. Some examples of how you could group content include:
- Website navigation
- Products
- Brands
- Content by stage of awareness
- Content by type (e.g. news, fashion, entertainment)
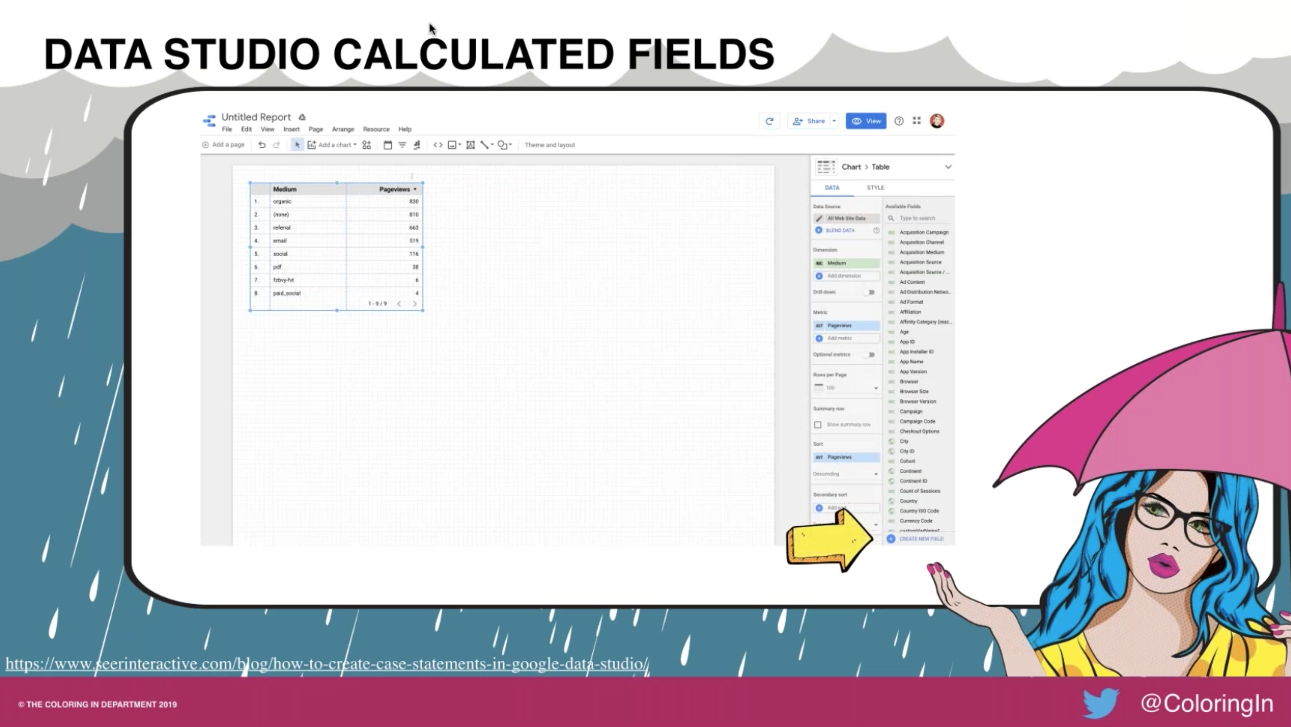
When creating Content Groupings, you are unable to retrospectively collect data for these in Google Analytics. However, Jill shared a way around this by using Google Data Studio and creating a calculated field with case statements that reflects the rules you have used in your Content Groupings. This will enable you to view and analyse the historical data there from your same Content Groupings you created in Google Analytics.
Content Groupings use case: stage of awareness
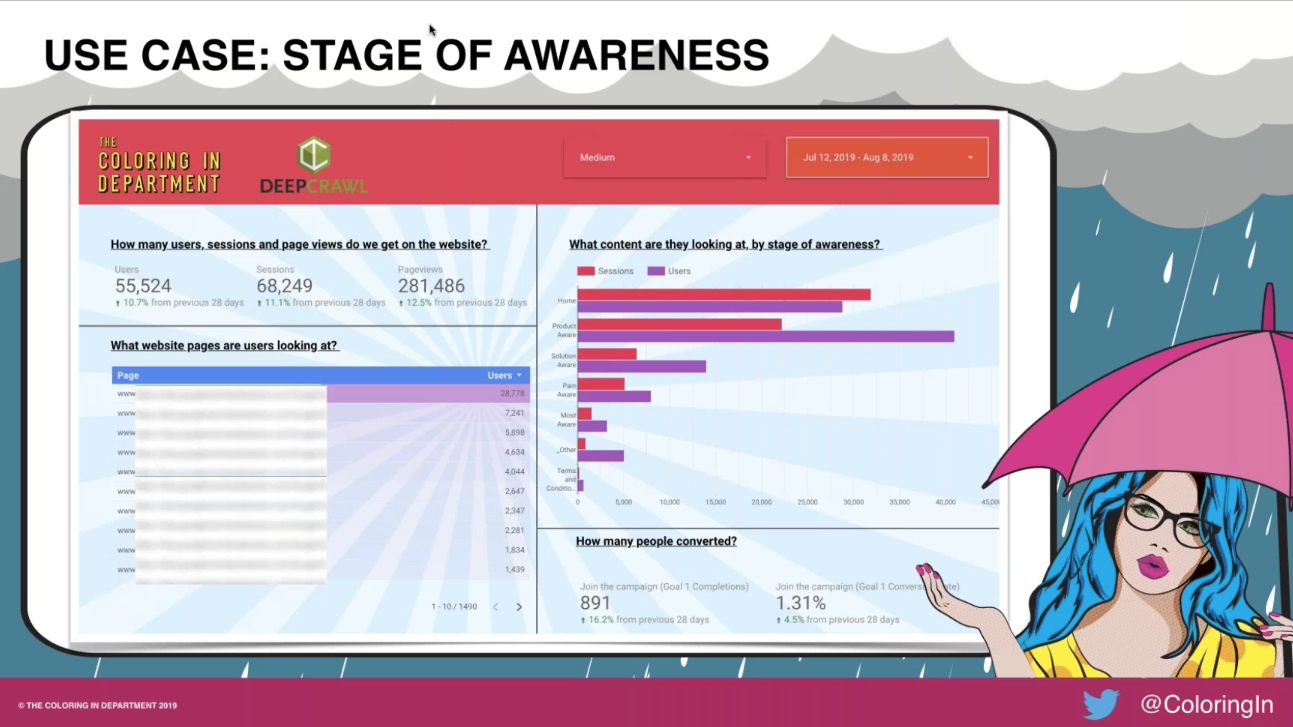
Jill shared a Google Data Studio dashboard she has created using these Content Groupings, looking specifically at users from organic traffic. The dashboard includes the number of users, sessions, and pageviews, as well as the content they looked at and the number of people who converted.
The Content Grouping used in this example is used to identify what content users are looking at by the stages of awareness. This was achieved by using keyword modifiers, following a typical user journey. Having this dashboard allowed Jill to inform her clients of the areas in which they were doing well, and where improvements were necessary, as well as gain a better understanding of how different channels were performing for each stage in the user journey.
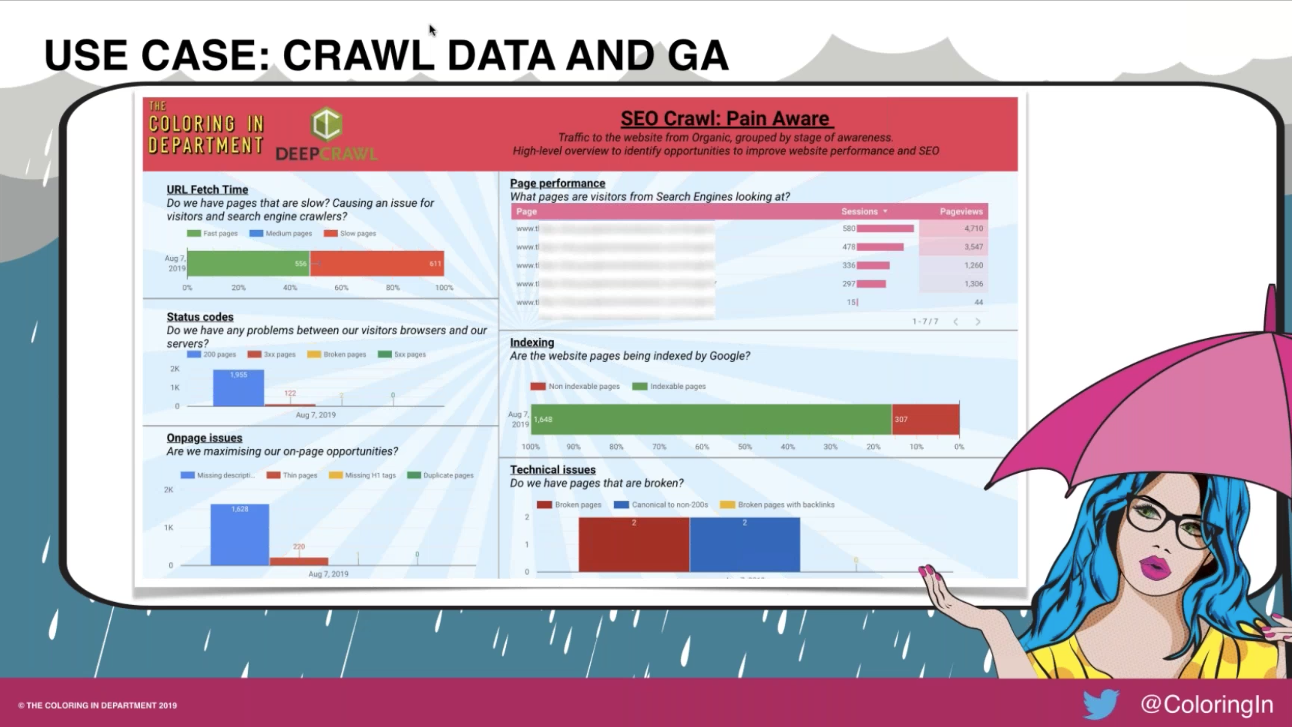
Content Groupings use case: crawl data
Jill was then able to apply these same Content Grouping rules to DeepCrawl crawl data for URL structures. This helped her client to identify the technical optimisations that needed to be done, by their priority. The dashboard was built in Google Data Studio by applying the Content Grouping rules to isolate which of the URLs were not performing well and identify problem areas based on technical issues, page speed and indexing.
Assisted Conversions
When reporting on the macro and micro conversions you have set up, it’s important to ensure each channel receives the credit deserved for directing users to complete the desired action. Jill explained one way this can be achieved is through assisted conversions.
The Assisted Conversions report is found under the Multi-Channel Funnels report and allows you to see how many macro conversions were assisted by a session or micro conversion within a particular channel, and thus understand how the different channels work together. Within this report you will be able to drill down by each individual goal, as well as specific landing pages, to get a clearer picture of how your marketing strategy is working.
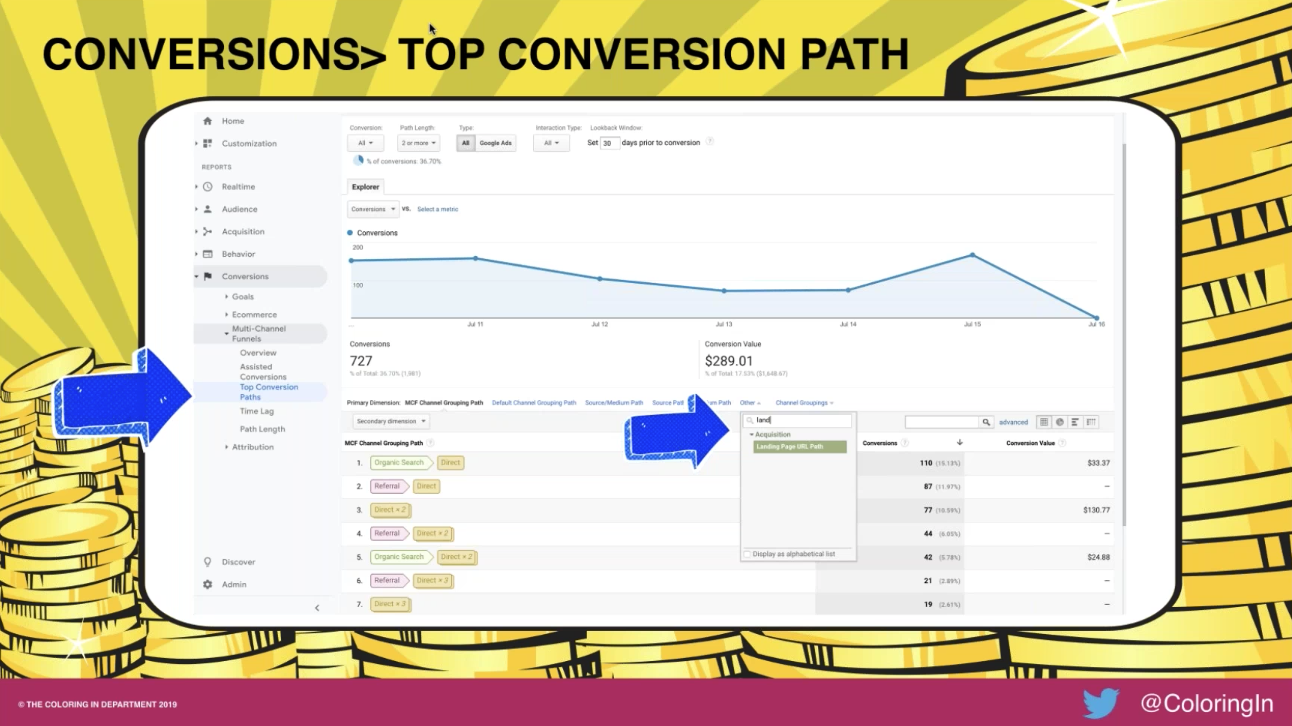
You can also look at top conversion paths to view what your website’s customer journey looks like. This enables you to identify your users’ actual journeys across the site and allows you to optimise for this accordingly.
Get started with DeepCrawl
If you’re interested in learning about how DeepCrawl can help you to identify technical issues on your site which are impacting both search engines and users, as well as create your own Content Groupings dashboard combined with DeepCrawl data, why not get started with a DeepCrawl account today.
Further Resources
For those of you who want some further reading, here are the posts Jill mentioned in her webinar. For more ideas on the themes of GA filters, The Coloring in Department have a handy explainer for the types of filters you should be looking at. Head this way to read up on Advanced Segments in Google Analytics. If you are looking to identify the best micro and macro goals, check out this post on website goals. And the use cases for content grouping, together, the data studio data mashup with DeepCrawl data is all written up here.