
In January 2022 we launched the new Lumar experience, giving a fresh new look to our platform, as well as improving navigation and performance. As part of this update, we created new categories and subcategories with relevant dashboards, charts and reports. In this product guide, we’ll take a look at the new category dashboards, take a closer look at Log Files and Search Traffic Reports, and provide a list of all the new charts and where to find them.
Category Dashboards
As part of the new left hand navigation, we’ve introduced dedicated dashboards for each category and subcategory, containaining charts specific to each section. We’ve also added a number of new trend lines, so you can quickly spot spikes and trends and act accordingly. By categorizing the reports, and providing these data visualizations, we’re providing steps toward diagnosis, so you can navigate through the categories to identify where to focus your attention. You can even click on a data point in the chart, and be taken directly to the relevant report with all the details.
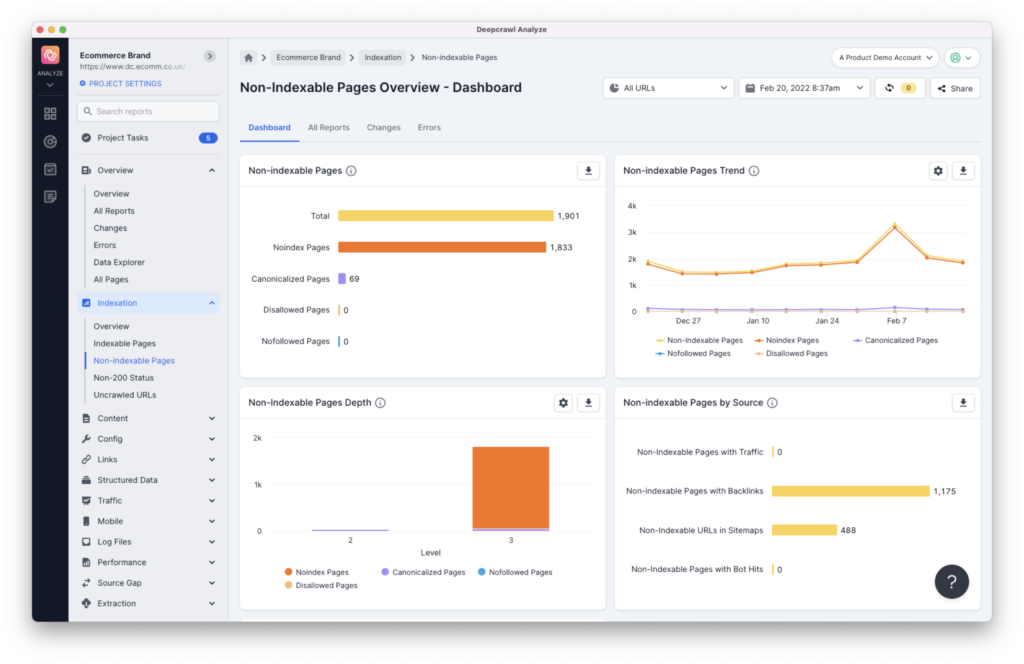
For example, when in a project, if you click into ‘Indexation’ you’ll see an overview dashboard that provides insights related specifically to indexation. Clicking into ‘Non-indexable pages’ will then give you a new dashboard specifically related to non-indexable pages.
Log Files
Log File Dashboard
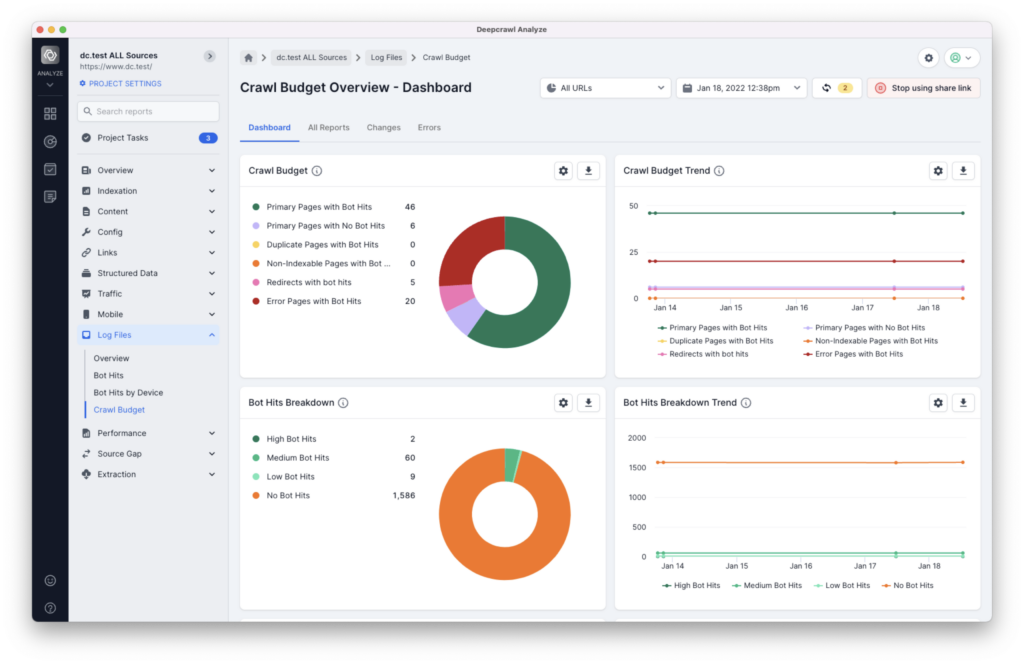
One of the areas we’ve made some more significant improvements is in our Log File Category. We’ve increased the investigation of the log file reporting, and therefore the analysis and insight that you get from log files.
We’re now providing a lot more visual detail, such as:
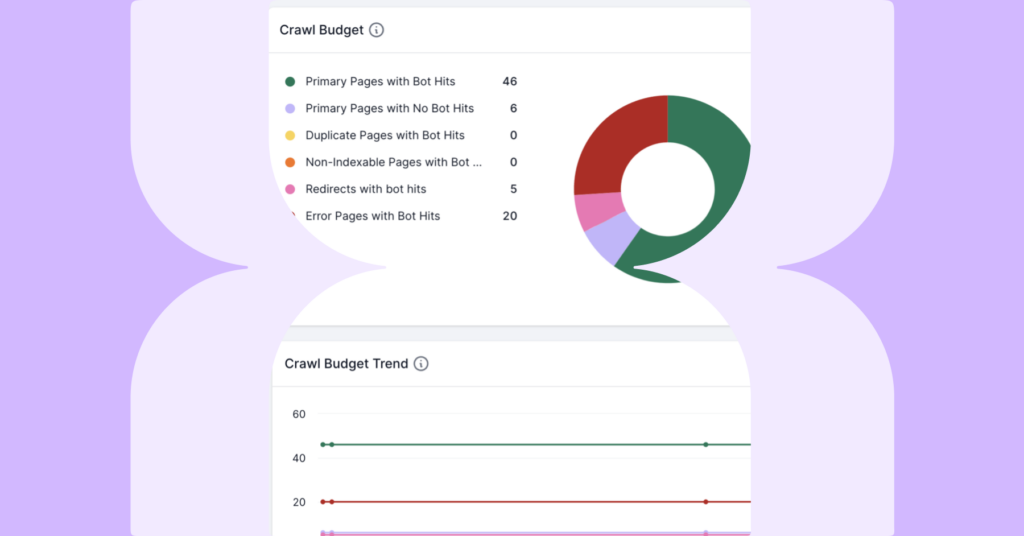
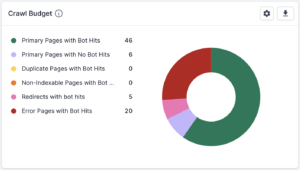
- Crawl Budget Breakdown giving a full breakdown of primary pages that are and are not receiving bot hits, as well as duplicate pages, non-indexable pages, error pages and redirects with bot hits.
- Trend Charts for how Google and other search engines are accessing your site, so you can see how efficiently bots are accessing your site over time.
- Bot Hits Breakdown Depth to show the depth of pages with bot hits. Those with a low amount of requests may be considered less important, or search engines may not think they change frequently enough to crawl often.
- Crawl Budget Issues which breaks down the issues with pages that had requests in the log summary files. Pages with low or no bot hits aren’t necessarily negative, but may indicate that search engines may think your pages do not change often or may not consider them important.
Google Search Console and Google Analytics
In the traffic category, we’ve also added a few more visualizations here – again so you can get more insights and see trends over time, including:
- Which types of pages are generating impressions or clicks easily?
- Which segments are performing the best in search?
- Which pages have impressions, clicks or visits but currently have issues?
Previously, our search traffic reports combined Search Console and Analytics data. We’ve now separated those into subcategories to give you better insights.
Let’s dive into a few of the reports available in the new Search Console and Analytics subcategories.
New Search Console Reports
Primary Pages in SERP without clicks (Traffic > Search Console)
This report shows unique and indexable pages that have had impressions in Search Console, but did not generate any clicks. You should investigate these pages to ensure your most important pages are properly optimized so they can generate traffic and conversions.
Non-indexable Pages in SERP (Traffic > Search Console)
These pages have been found to be non-indexable, but have had impressions in Search Console during the report period. It’s important to remember that the Search Console data is collected from the report period set—the default date range being 100 days. The crawl data is from the specific time spent crawling the site, so will be from a more recent and shorter time period.
This report shows all the URLs which had impressions in search results during the report period, but that Lumar determined to be non-indexable during the crawl because they were at least one of the following: Canonicalized; Noindexed; or Disallowed via Robots.txt. It can therefore be used to flag issues to investigate, such as:
- Pages recently made non-indexable. If a URL has impressions but we found it to noindex during the crawl, it could mean it’s recently changed to noindex. These URLs should be reviewed in case it’s an error.
- Search engines cannot crawl the page to see the noindex. If a URL is set to noindex but is blocked by robots.txt it can’t be crawled to see the noindex, which means it will not be removed from search.
- URL is hard to find for search engines. Search engines may not have found and crawled the URL yet to see the noindex directive.
- Google is ignoring the canonical URL. Canonical is a hint, not a directive, so Google may be ignoring the suggested canonical, and keeping the original indexed based on other signals like internal linking, backlinks or redirects.
Full List of New Search Console Reports
These reports can be found in the Search Console subcategory in Traffic.
Google Search Console Search Funnel:
- Primary Pages in SERP with Clicks – These pages are unique and indexable, and have had clicks in Search Console during the report period. This signals that the pages were indexed and have had click-throughs from the organic search results.
- Primary Pages in SERP without Clicks – These pages are unique and indexable, and have had impressions in Search Console during the report period but did not generate any clicks. This means that the pages were visible in search results but received no click-throughs to the website. You should investigate these pages to ensure that they are optimized.
- Primary Pages not in SERP – These pages are unique and indexable but did not have any impressions in Search Console during the report period. You should investigate these pages to ensure that they are optimized and that they are discoverable by search engines.
- Duplicate Pages in SERP – These pages are classed as duplicate (they share an identical title, description and near identical content with other pages found in the same crawl) but have had impressions in Search Console during the report period. You should investigate these pages to ensure that they are either unique or consolidated with other pages.
- Non-Indexable Pages in SERP – These pages were found to be non-indexable but have had impressions in Search Console during the report period. See above for more details.
- Redirects in SERP – These pages are redirecting, but have had impressions in Search Console during the report period. You should investigate these pages to check they are redirecting to relevant pages and are using the correct HTTP status code (e.g. 302 redirects are considered to be temporary, therefore it may take longer for Google to update these URLs in the index).
- Error Pages in SERP – These pages return an error status code (400, 404, 410, 500 or 501) but have had impressions from Search Console during the report period. These pages are at high risk of losing rankings. Landing on an error page is a poor user experience, so search engines attempt to remove these pages from their index as soon as they detect the error. The broken pages or links to them should be fixed if they are broken due to an error or malformed link. If the page no longer exists and there is an equivalent working page, a redirect could be set up.
Google Search Console Traffic Level:
- Primary Pages with X to Y Clicks – Primary pages that have driven clicks from Google Organic SERP, broken down into quantity-based groups (1 to 10 clicks, 10 to 100, 100 to 1,000, 1,000 to 10,000 and over 10,000).
New Analytics Reports
Redirects with Visits (Traffic > Search Analytics)
This report can be used to view the pages that are redirecting, but have had visits based on Google Analytics data within the report period. You should investigate these pages to check that they are redirecting to relevant URLs and are using the correct HTTP status code. For example, 302 redirects are considered to be temporary, and it may therefore take longer for Google to update these URLs in the index.
Error Pages with Visits (Traffic > Search Analytics)
This report can be used to view all URLs which Lumar found to return a broken status code during the crawl (4xx or 5xx) but had visits based on the Analytics data within the report period.
These pages were found to be broken at the time of the crawl and so the content is no longer accessible. These URLs which are now broken or removed were shown to be driving visits from organic search traffic. A broken page creates a poor experience for users landing on the website and also means that search engines will eventually remove the URL from the index. If the page has broken due to an error, this should be investigated and fixed. If the page has been permanently removed but has an equivalent page, consider adding a 301 redirect to the new URL version. You can use segmentation and visit counts to help prioritize the URLs to investigate first.
Full List of New Analytics Reports
These reports can be found in the Analytics subcategory in Traffic.
Analytics Traffic Funnel:
- Primary Pages with Visits – These pages are unique and indexable, and have had visits during the report period based on the analytics data. This signals that the pages were indexed and have had visits from organic search results.
- Primary Pages without Visits – These pages are unique and indexable, but have not had visits, based on the analytics data within the report period. You should investigate these pages to ensure that they are optimized and discoverable by search engines.
- Duplicate Pages with Visits – These pages are classed as duplicate (they share an identical title, description and near identical content with other pages found in the same crawl), but have driven visits based on analytics data within the report period. You should investigate these pages to ensure that they are either unique or consolidated with other pages.
- Non-indexable Pages with Visits – These pages were found to be non-indexable but have had visits, based on analytics data within the report period. This signals that Google is ranking pages which were found to be canonicalized, noindexed, or disallowed in the crawl. See above for more details.
- Redirects with Visits – These pages are redirecting, but have had visits based on the analytics data within the report period. See above for more details.
- Error Pages with Visits – These pages return an error status code (400, 404, 410, 500 or 501) but have had visits, based on analytics data during the report period. See above for more details.
Full List of New Charts
Indexation
Overview:
- HTTP Status Depth Chart – Shows the depth of HTTP status for pages on your website.
Indexable Pages:
- Indexable Pages Breakdown Chart – Shows the breakdown of URLs which are indexable, and can appear in a search engine’s index.
- Indexable Pages Breakdown Trend – Trend of indexable pages found over time.
Non-Indexable Pages:
- Non-Indexable Pages Trend – Trend of URLs made non-indexable with a noindex tag or canonical tag, pages which are disallowed in robots.txt and pages where all the internal links are nofollowed. These pages will either not appear in a search engine’s index, or are not likely to show in search results due to their configuration. The pages in these reports should be reviewed to ensure the configuration is deliberate.
- Non-Indexable Pages Depth Chart – Shows the depth of pages on your website which are not indexable.
Non-200 Status:
- Non-200 Pages Trend – Trend of URLs that returned an HTTP status that is not 200 over time. These URLs will not usually be indexed in search engines but will use up some crawl budget and may be a poor experience for users and should be minimized.
- Non-200 Pages Depth Chart – Shows the depth of URLs in the crawl which returned an HTTP status that is not 200.
- Non-200 Pages by Status Code – Shows the distribution of non-200 status codes.
Content
Titles & Descriptions:
- Title & Description Issues Trend – Trend of the title and description issues found over time. Long, short, and missing page titles or meta descriptions can have a negative impact on search engine performance as these dictate what shows on search result pages.
Body Content:
- Content Issues Trend – Trend of potential content issues within your website over time. Thin and Empty pages are those with less textual content than specified in the crawl settings, and Max Content Size are pages which are larger than the threshold in your settings.
- Content Duplication Trend – Trend of duplicate content over time. Duplication is detected within page titles, meta descriptions, body content, and a combination of these (in the case of ‘duplicate pages’).
Resources:
- Content Type Breakdown Trend – Trend of the non-html resources that were discovered across crawls.
- Resource Issues Trend – Trend of issues that were found within the resources over time. Resources can be Images, Javascript, or Stylesheet files.
Config
Redirects:
- Redirect Breakdown Trend – Trend of the types of redirects found in crawls. Redirects are those which are triggered via the HTTP headers, and meta redirects are triggered using the meta refresh HTML tag.
- Redirect Issues Chart – Showing potential redirect issues within your site (e.g. Redirect Loops, Redirect Chains, etc.).
- Redirect Issues Trend – Trend of potential redirect issues found in crawls over time.
HTTPS:
- HTTP & HTTPS Breakdown Trend – Trend of pages hosted on HTTP and HTTPS URL variations included in crawls. Most sites should only use a single type, so any significant volume of URLs in both may indicate a crawl setup error or a problem with the site architecture.
Pagination:
- Pagination Trend – Trend of pages found in paginated sets in crawls. First pages are those which do not have a prev link, and paginated pages are all others.
URL Design:
- URL Design Issues Chart – Showing the pages with potential URL design issues.
- URL Design Issues Trend – Trend of pages with potential URL design issues.
Rendering:
- Rendering Issues Trend – Trend of pages with potential rendering issues.
Links
Internal Links:
- Broken Links Trend – Trend of internal broken links discovered during crawls.
- Links Breakdown Trend – Trend of links that were found during the crawl by their source.
External Links:
- External Links Trend – Trend of external links found during crawls.
Sitemaps:
- Sitemaps Chart – Showing the XML sitemaps that were found in the crawl.
- Sitemap Issues Trend – Trend of issues found within the links discovered in sitemaps.
- Sitemaps Trend – The count of XML sitemaps that were included in crawls over time.
Backlinks:
- Backlink Issues Trend – Trend of issues found within pages which have backlinks.
- Pages with Backlinks by Depth Chart – Shows the depth of pages on your website which have backlinks.
Structured Data
Schema Types:
- Structured Data Types Trend – Trend of the structured data types found in the crawl.
Traffic
Search Console:
- GSC Funnel Trend – Trend of pages in Google Search Results (SERP).
Mobile
Mobile Issues:
- Mobile Issues Trend – Show a trend of mobile configuration issues that were discovered during the crawl. Mobile reciprocation issues occur when separate mobile, AMP, or desktop pages do not correctly reference their alternates. The mismatch reports show mobile and desktop alternates which have different content or internal linking.
Categorization:
- Mobile Configuration Trend – Shows a trend of the mobile configuration that each of the pages in the crawl have. Pages can be responsive, dynamically served, have a separate desktop/mobile configuration, or be an AMP page.
Log Files
Bot Hits:
- Bot Hits Breakdown Depth Chart – Shows the depth of pages with bot hits based on level depth where they were found. Pages with a high number of requests may be considered important or may change often. Those with a low amount of requests may be considered less important, or search engines may not think that they change frequently enough to crawl often.
- Bot Hits Breakdown Trend – A trend of pages which had hits in the Log Summary, broken down by the levels in the project settings.
Crawl Budget:
- Crawl Budget Chart – A full breakdown of primary pages which do and do not have bot hits, as well as duplicates, non-indexable pages, error pages and redirects with bot hits.
- Crawl Budget Trend – A trend line covering primary pages with and without bot hits, and duplicates, non-indexable pages, error pages and redirects with bot hits.
- Non-200 pages with Bot hits by status code- Distribution of non-200 status codes for pages with Bot Hits.
Performance
Overview:
- Slow Performance Pages – Shows a breakdown of pages with slow performance issues found in the crawl.
- Slow Performance Pages Trend – Trend of pages with slow performance issues found over time.
- Average Performance Pages – Shows a breakdown of pages with average performance found in the crawl.
- Fast Performance Pages – Shows a breakdown of pages with fast performance found in the crawl.
Fetch Time:
- URL Fetch Time Trend – Trend of the fetch time for the URLs in crawls.
Server Response:
- Server Response Time Trend – Trend of Time to First Byte (TTFB) for the URLs in the crawl over time.
First Contentful Paint:
- First Contentful Paint Shift Trend – Trend of the First Contentful Paint for the URLs in the crawl.
Largest Contentful Paint:
- Largest Contentful Paint Shift Trend – Trend of the First Contentful Paint for the URLs in the crawl.
Cumulative Layout Shift:
- CLS Trend – Trend of the Cumulative Layout Shift for the URLs in the crawl.
Time to Interactive:
- Time to Interactive Trend – Trend of the Time to Interactive for the URLs in the crawl.
COM Content Load Trend:
- DOM Content Load Trend – Trend of the DOM Content Load for the URLs in the crawl.
Source Gap
Overview:
- Pages in and not in Crawl Sources Chart – Shows a breakdown of pages that were found or not found in individual sources: web, sitemaps, gsc, analytics, log files and list crawl.
- Pages not in Source Trend – Shows the trend of pages not found in individual sources.
Web Crawl:
- Pages in Web Trend – Trend of pages found and not found in the Web crawl URL source.
List:
- Pages in List Trend – Trend of pages found and not found in the List URL source.
Sitemaps:
- Pages in Sitemaps Trend – Trend of pages found and not found in the Sitemaps URL source.
Backlinks:
- Pages in Backlinks Trend – Trend of pages found and not found in the Backlinks URL source.
Analytics:
- Pages in Analytics Trend – Trend of pages found and not found in the Analytics URL source.
Search Console:
- Pages in Search Console Trend – Trend of pages found and not found in the Source Console URL source.
Log Summary:
- Pages in Log Summary Trend – Trend of pages found and not found in the Log Summary URL source.
Our team are working on even more new charts and reports, so we’ll update you as soon as we have more news!


