

Lumar’s site speed metrics help you speed up your websites to deliver a better experience for prospects and customers, and identify byte savings to reduce costs. Our site speed metrics include both lab and field data, covering the full Lighthouse performance metrics at scale (for the lab data) as well as origin-level field data from the Chrome User Experience Report (CrUX), which reflects the aggregate experience for a subset of actual users, providing an additional perspective on the performance of your site, and helping validate the lab metrics.
As with technical SEO and accessibility metrics, our health scores in Lumar Analyze help you quickly see which areas need addressing, and prioritize accordingly. Aggregated issues avoid data overload, and help you identify the biggest opportunities, and detailed information on how to fix issues helps you write clear acceptance criteria for dev tickets, so you can get things fixed.
In addition to site speed performance improvements, Lumar also provides analytics on technical SEO issues that negatively impact search performance, accessibility issues that prevent people using your site effectively, and custom metrics to analyze your site’s unique elements. Get in touch with us if you’d like to know more.
Why is Site Speed Important?
The speed of your site has a significant impact on its success. Google has confirmed page experience as a ranking factor, and slower pages cause visitors to switch to competitors. Therefore, site speed directly impacts conversion and bounce rates and, ultimately, revenue. What’s more, slow sites generally have higher content and resource storage costs, so your site’s speed can seriously impact your bottom line.
What Benefit Does Improved Site Speed Bring?
The benefits of improving site speed essentially boil down to two key areas—increased conversions and revenue, and reduced costs.
Increased Conversions and Revenue
When prospects or customers visit your site, its speed is a key factor in the experience they receive. Visitors want to get the information they need or find the products they want to buy, as quickly as possible.
If pages are slow to load, or content shifts around on the page excessively, this will cause frustration and increase the likelihood of them switching to a competitor.
What’s more, Google has announced that ‘page experience’ will be a ranking factor in Google Search, so the speed and usability of your site will also have a direct impact on its discoverability.
Research by New Relic showed that conversion rates increased by 2% for every 1 second of improved load time, and sites meeting Core Web Vitals thresholds were 24% lower.
Speed savings can come from a number of areas, including:
- Third-party resources
- Multiple redirects
- Render-blocking resources
- Long main thread tasks
- Long execution time JavaScript files
Identifying and addressing issues like these will increase the page’s speed and, therefore, provide a better user experience which leads to more conversions, and ultimately increased revenue.
Reduced Costs
Larger file sizes (e.g. images) will obviously increase the storage capacity required to host elements of the website. But it can also impact potential bandwidth charges when users request files from servers. And it’s not just file size that could be the issue. Size savings can come from a number of areas, including:
- Older inefficient file types or unoptimized images
- Uncompressed text files
- Unused JavaScript resources
- Unused CSS files
Identifying and addressing issues like these will not only increase the page’s speed but can also help reduce storage and bandwidth charges.
Who Are the Site Speed Metrics For?
Lumar’s site speed metrics are useful for businesses with large websites that want to understand, prioritize, and address performance issues on their sites.
For businesses with smaller sites, Google provides a free Chrome extension to run Lighthouse on a single page. However, for businesses with larger sites, this can be very time-consuming and difficult to prioritize with issues isolated to a single page. These are exactly the challenges we’ve addressed with our site speed metrics in Lumar.
Key Lumar Benefits
Save time and understand your site better with Lighthouse performance reporting at scale
As mentioned above, using a tool that only addresses one page at a time on a large website is incredibly inefficient. Lumar crawls and analyzes a huge number of pages in a single crawl, so you can better understand which issues are causing the greatest problems across your site.
Effectively prioritize with aggregated issues and health scores
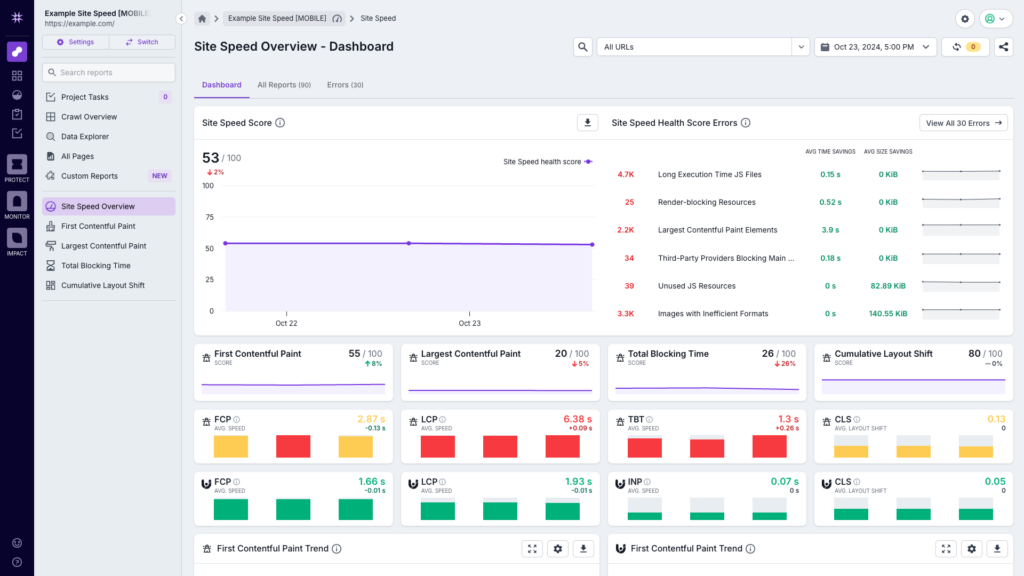
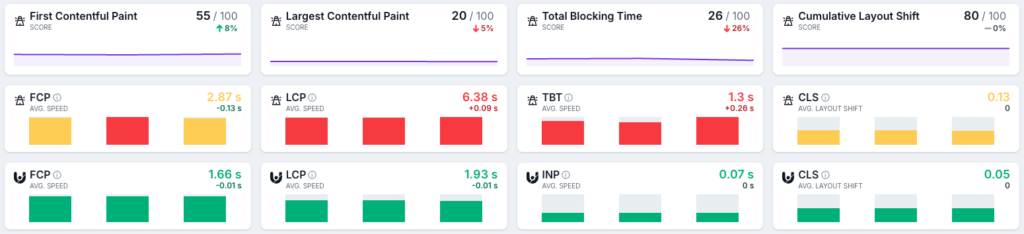
With analysis of issues across many pages at a time, Lumar is also able to aggregate those issues across your site. This allows you to see the total speed and size savings available, so you can focus on the biggest opportunities first. We also provide an overall site speed health score, plus scores and trend graphs aligned to the Lighthouse performance metrics. This helps you quickly identify where to focus and drill down into the detail where you need to—avoiding data overload.
Improve collaboration with clear guidance on how to fix issues
One of the main blockers for getting issues fixed is a lack of clear guidance to developers on how to fix issues. Lumar provides detailed information on every report, what problems the issue can cause, how to fix it, and the positive impact you’ll see as a result. This means you can write clear acceptance criteria for tickets, so developers know exactly what they need to do to get the issues resolved.
Which Metrics Does Lumar Cover?
In relation to site speed, Lumar includes follows Google’s Lighthouse performance reporting, and the Chrome User Experience (CrUX). We report the following metrics from these data sources:
- Lighthouse Performance Reporting:
- First Contentful Paint (FCP), which measures the time from when the user first navigated to a page, to when any part of that page’s content (text, images, elements, or non-white <canvas> elements) is rendered on the screen.
- Largest Contentful Paint (LCP), which measures the render time of the largest image of text block visible in the viewport, relative to when the user first navigated to the page.
- Total Blocking Time (TBT), measuring the total amount of time after FCP where the main thread was blocked for long enough to prevent input responsiveness. Note that this also correlates well with First Input Delay (FID) which is a field metric measured in Core Web Vitals.
- Cumulative Layout Shift (CLS), which is the measure of the largest burst of layout shift scores for every unexpected layout shift that occurs during the entire lifecycle of a page.
- Speed Index Score, which measures how quickly content above the fold is visually displayed during page load.
- Chrome User Experience Report (CrUX):
- First Contentful Paint (FCP), is the same as Lighthouse above, but for your origin, by device, as measured by CrUX.
- Largest Contentful Paint (LCP), is the same as Lighthouse above, but for your origin, by device, as measured by CrUX.
- Interaction to Next Paint (INP). Like TBT, this is another measure of how responsive a web page is but differs from TBT in how and what is measured. INP assesses responsiveness using data from the CrUX Event Timing API, observing the latency of all the interactions a user has made with the page, and reporting a single value which all (or nearly all) interactions were beneath.
- Cumulative Layout Shift (CLS), is the same as Lighthouse above, but for your origin, by device, as measured by CrUX.
Ready to Get Started?
To get started with Lumar’s Site Speed metrics, simply fill out this form and we’ll get in touch to organize a demo. Or, if you’re an existing customer with a Customer Success Manager (CSM), feel free to reach out to them to arrange.


