

Introduction
Protect allows you to take a proactive approach to accessibility, and prevent issues being introduced to your site when new code is published. This saves huge amounts of time rectifying issues on the live site, while mitigating the risk of non-compliance.
In Protect, you can configure test suites for a variety of tests, to run as new code is published. These can be flagged as warnings or failures and, if integrated to your CI/CD pipeline, failures will stop the build going live, allowing you to rectify issues before the site is updated.
Setting Up a Test Suite
Step 1 – Connecting your site
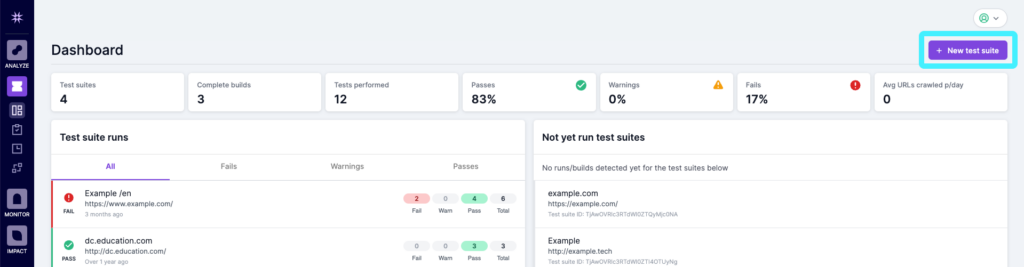
From the dashboard, click on the purple ‘New test suite’ button at the top right hand corner of the screen.
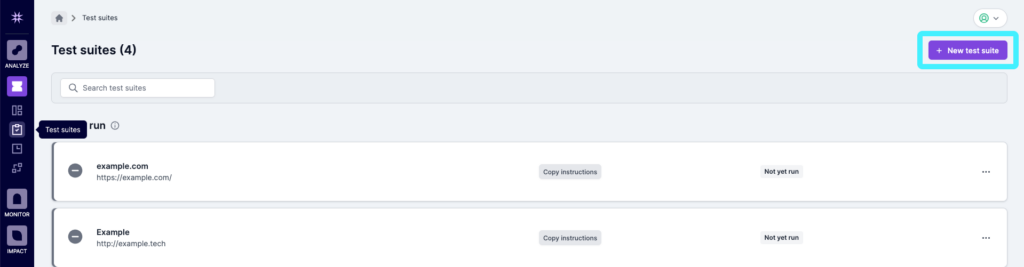
This button is also available on the ‘Test Suites’ page.
In Step 1, give your test suite a name, so you can understand the nature of the crawl once it’s run, and add in the domain/subdomain details.
You can also add any necessary authentication in this step by expanding the ‘Authentication and Whitelisting’ section.
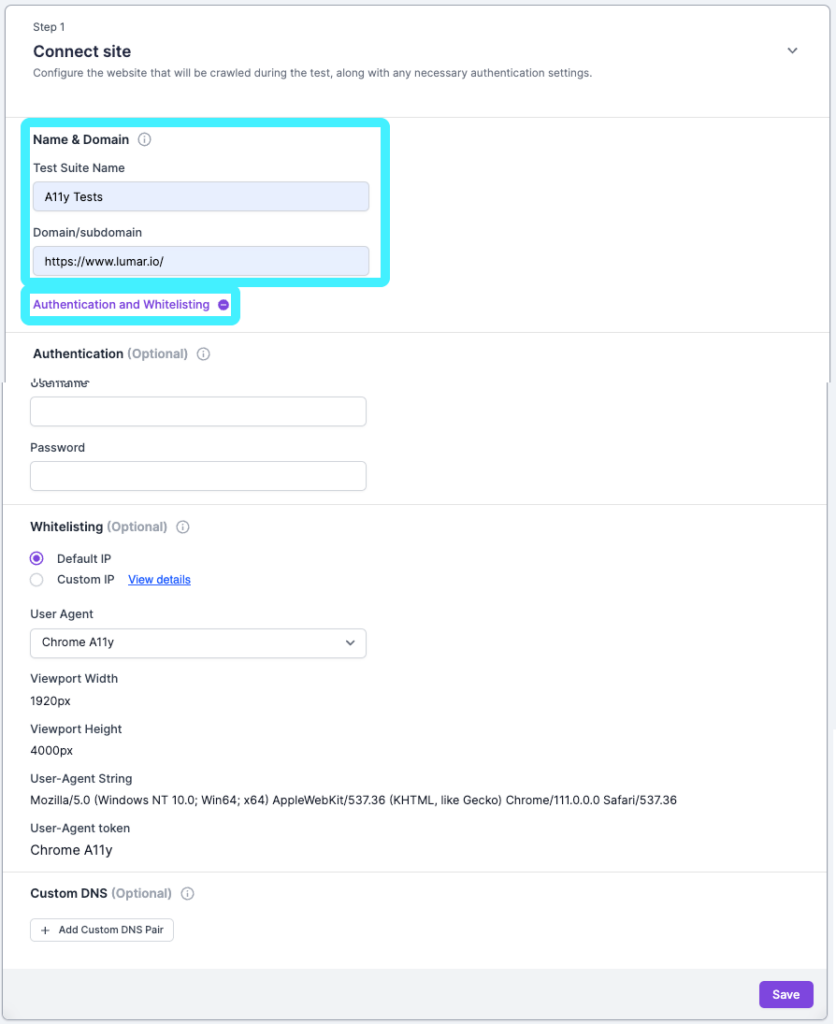
You can choose from authentication using Username and Password, IP Whitelisting or Custom DNS, or a combination of these methods:
- Authentication: If your site requires a username and password for the crawler to gain access, you can enter that information here.
- Whitelisting: Lumar uses the IP address 52.5.118.182 or 52.86.188.211 by default. These are the IP addresses a network administrator would need so that Lumar can bypass any firewalls or blocks you may have in place.
- Custom DNS Settings: These might be needed if you are testing a staging environment. The only caveat is that you cannot use this setting with JS rendering turned on.
Once you’ve filled in the relevant details, click ‘Save’ to move onto the next step.
Step 2 – Choosing your crawl settings
In Step 2 you can choose your crawl settings. In the top section, choose the type of crawl.
- Web crawl, where the crawler will start at the domain/subdomain you specified in Step 1, and follow links to crawl your site. For example, you could choose to start your crawl at a specific subdomain to test an important part of your site.
- List crawl, where you can upload a test or .CSV file with a list of specific URLs to crawl. You can use this option to upload a list of URLs built on specific templates to check for errors.
You can choose between these options, or select both.
JavaScript rendering is enabled by default to make sure the crawler does not miss valuable code and content. For accessibility crawls, this setting cannot be disabled.
To set the crawl speed, use the slider to choose the appropriate crawl speed for your site. When choosing the crawl speed, you should consult with your web ops team to determine the best speed, based on your server capability.
In the URL Limit field, choose the number of URLs that will be completed in the crawl. As Protect is focused on a specific purpose, you can choose a limit of up to 10,000 URLs. In Analyze (where the crawl scope is much broader) the limits are much higher.
Finally, you can also add any custom extraction rules that you want to include.
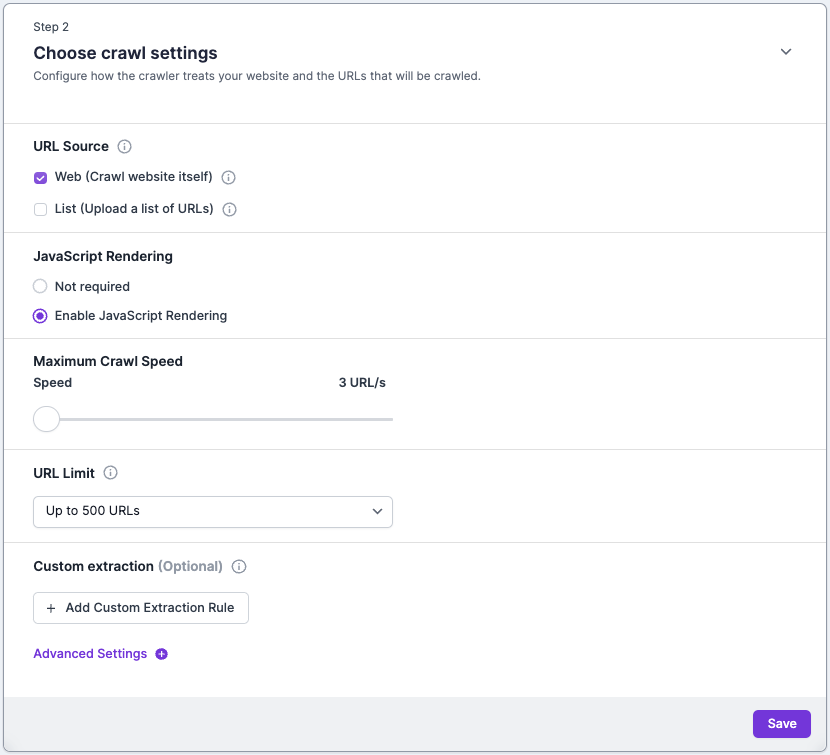
At the bottom of this section, you can expand the ‘Advanced Settings’ section to access additional settings:
- Start URLs: To start the crawl from somewhere other than the primary domain.
- Include and Exclude URLs: To limit your crawl to URLs that only include your specified paths, use regular expressions to match specific paths if required. Alternatively, you can add URL paths to exclude them from the crawl. When using this feature, note that exclude rules will take precedence over include rules. If you use Include or Exclude URLs, you must also include those URLs as Start URLs.
- Robots.txt Overwrite: To replace the live robots.txt for the primary domain with an alternative.
- JavaScript Rendering Settings: Here you can add additional settings, including blocking ad or analytics scripts, blocking scripts URLs, injecting custom JS snippet, or including external JS resources.
- Test Settings: These are Lumar’s recommended levels for settings such as maximum title width, thin or empty page thresholds, or duplicate precision values. If you need to amend these, you can do so here.
Step 3 – Choosing your tests
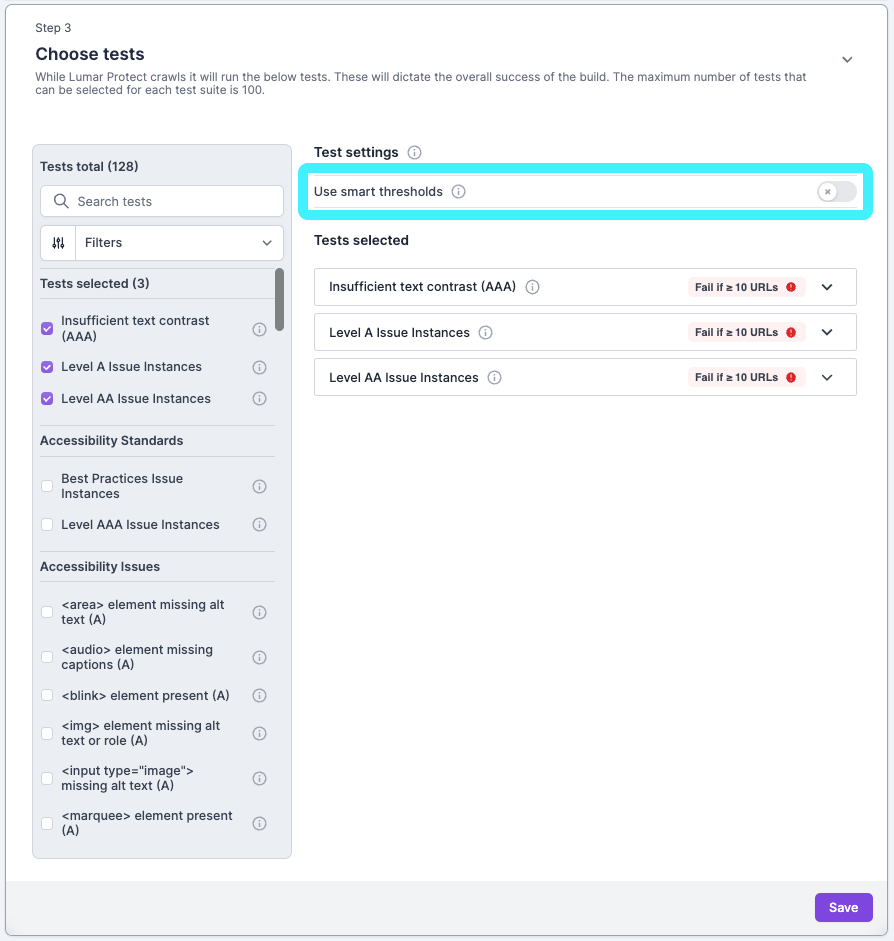
In Step 3 you can choose up to 100 tests to include in the test suite. When Protect crawls, it will run these tests to dictate the overall success of the build. You can choose from over 90 tests related to accessibility.
At the top of step 3 you can search for the particular tests you want to include, and check the box next to the name to add it to the test suite. For accessibility, you can also check the relevant accessibility standard (e.g. Level A or Level AA) to check for all issues related to that level.
As you check the relevant options, you’ll see them populate on the right hand side of the screen.
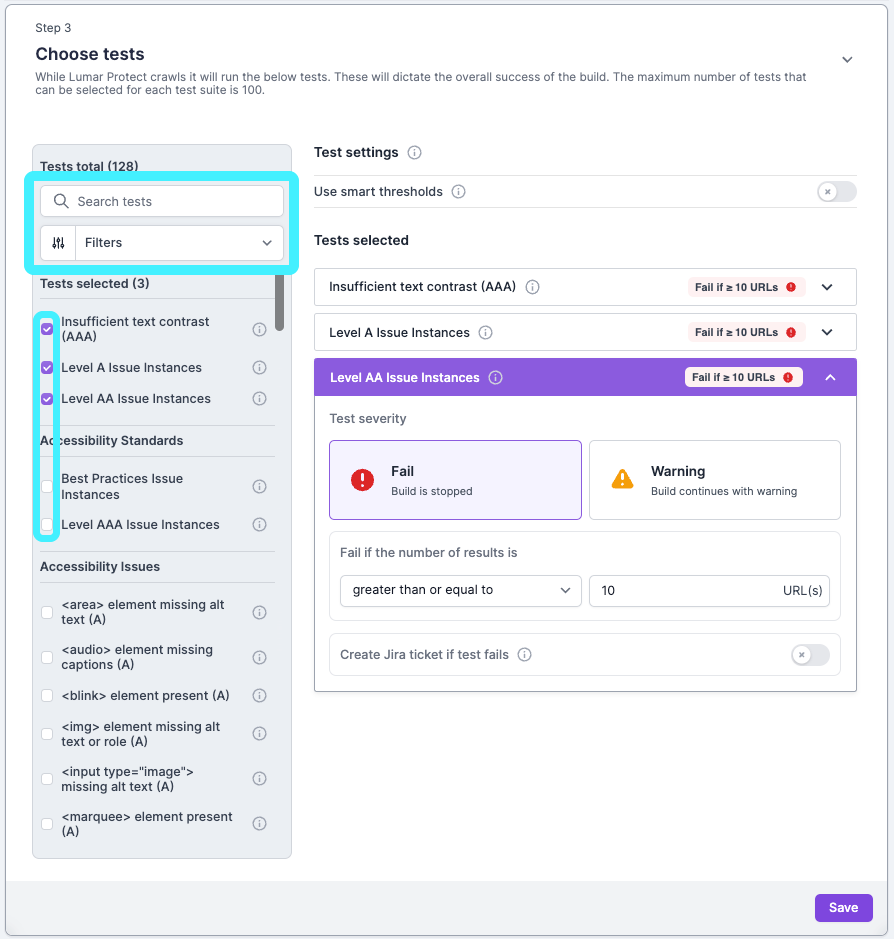
Once you’ve added tests to the test suite, you can then click on each one on the right hand side to choose the test settings:
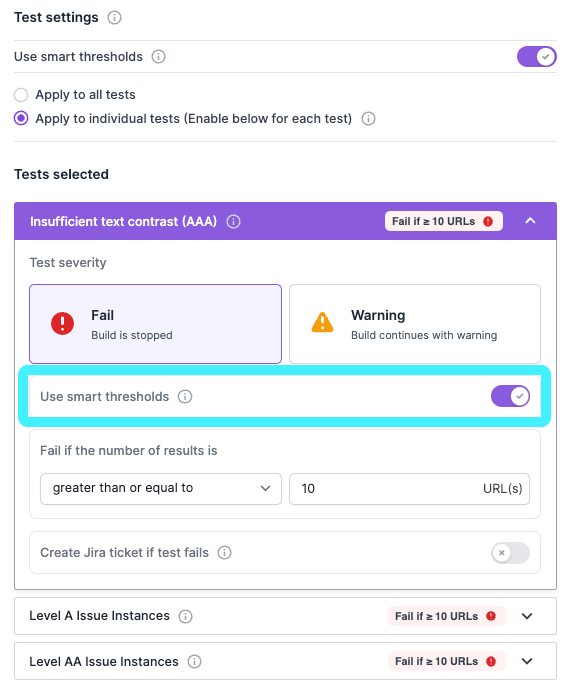
- Test severity. Choose whether the threshold breach will result in a fail (which stops the build) or a warning (where the build continues).
- Use smart thresholds. Automatically adjust thresholds based on the worst performance from the previous five crawls. Find out more about smart thresholds in Lumar Protect below.
- Failure threshold. Choose the number of URLs that will trigger the warning or failure in Lumar Protect.
- Jira ticket creation. You can also integrate Protect with Jira, to automatically create a ticket when a Fail or Warning is triggered. Once integrated, click the slider to enable.
Step 4 – Set notifications
In Step 4 you can choose the relevant notifications for your test suites. For email, your own address will appear with notifications set for passes, passes with warnings and fails by default. If, for example, you don’t want to receive an email notification for passes, simply uncheck the box. You can also add in any other email addresses using the ‘New email’ button, and again select which notifications they will receive an email for.
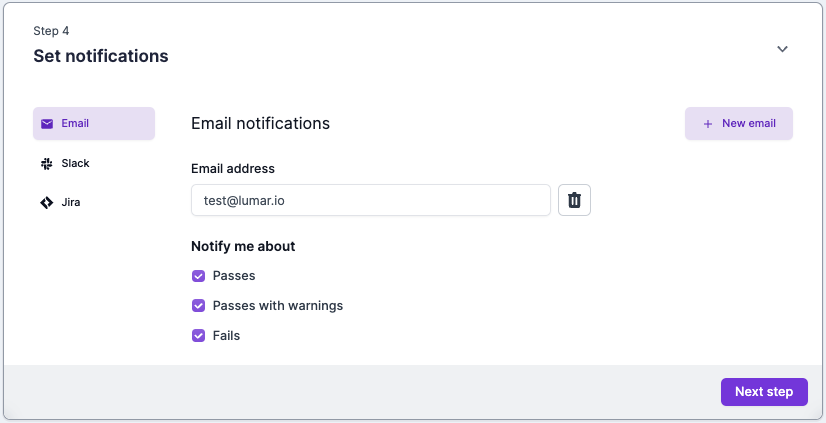
Protect can also deliver notifications via Slack. This can be easily set up using a webhook, to deliver notifications to one or more Slack channels. You can also integrate Protect with Jira to automatically create issues in your backlog for fails and warnings generated when test suites run.
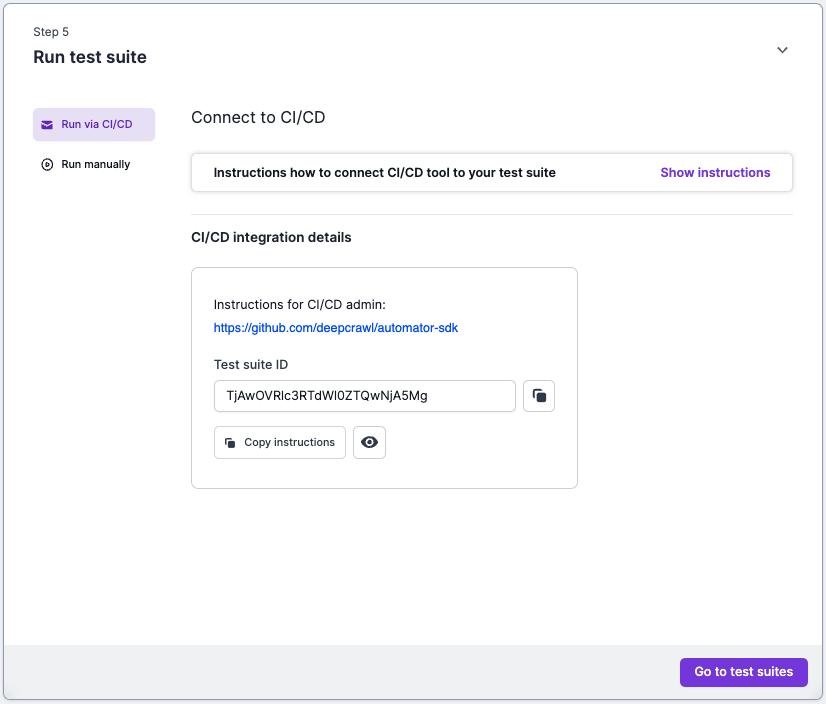
Step 5 – Running your test suite
In the final step you can choose how you run your test suite:
- Run via CI/CD. With this method, when development push new elements from staging to live, Protect will run the test suites. If everything passes, publishing to the live site will complete. However, if any tests fail, it will be stopped and sent back to dev so they can fix the issues that didn’t pass. If you choose to run via CI/CD, you’ll find instructions by clicking ‘Show instructions’ under Connect to CI/CD. Instructions for the CI/CD admin can be found here.
- Run manually. If you don’t want to connect Protect to your CI/CD pipeline, you can run the test suites manually. Simply go to that option and click ‘Run test suite’.
You can also schedule the test suite to run at a later date (see below). If you do want to set a schedule, click on ‘Go to test suites’ in the bottom right corner of the screen.
Step 6 – Viewing crawl results
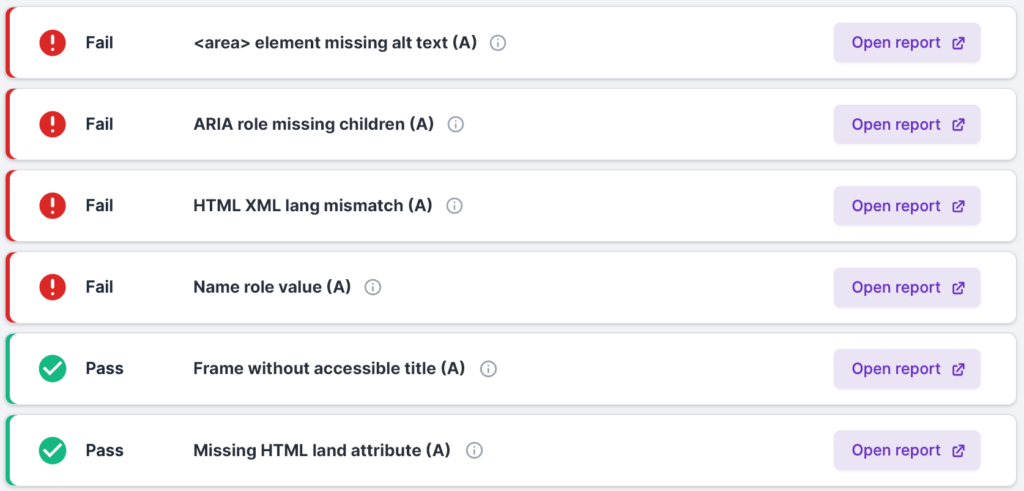
The results can be seen on the Protect home page once the crawl has completed. The Builds list shows top level information about each build (crawl) and the number of tests that passed or failed.
If integrated to your CI/CD pipeline, when all tests pass or give warnings then the build will pass. If one test fails, the build will fail.
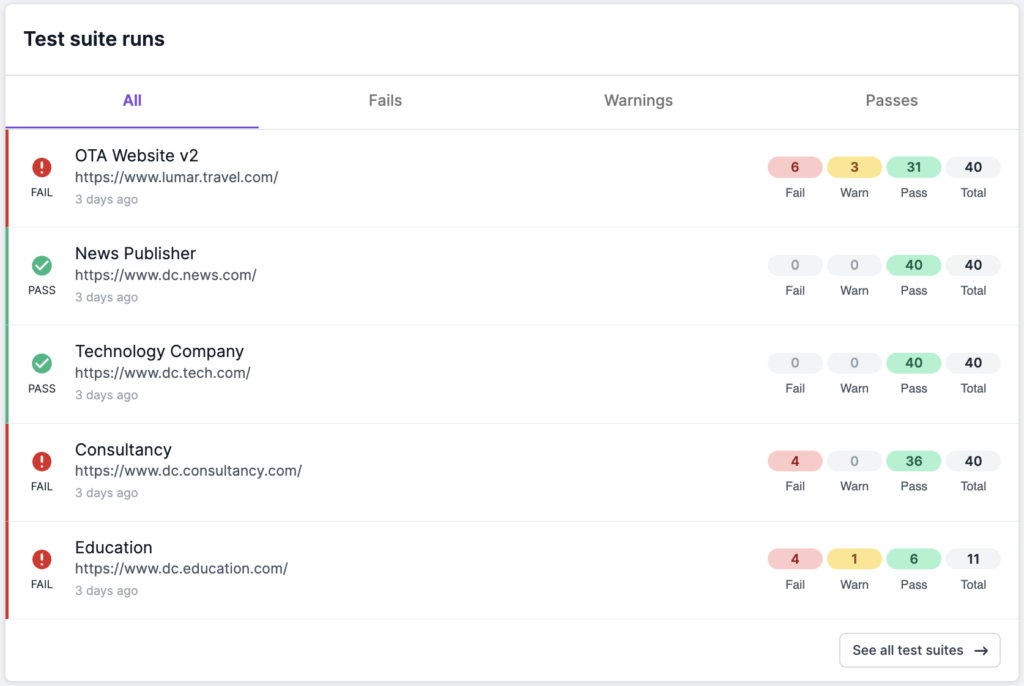
Clicking into the test suite will take you to the build detail page which shows each test that passed, failed, or gave a warning. You can see more detail about the URLs in each test by opening the Lumar report in Analyze.
Bonus Step – Scheduling a test suite run
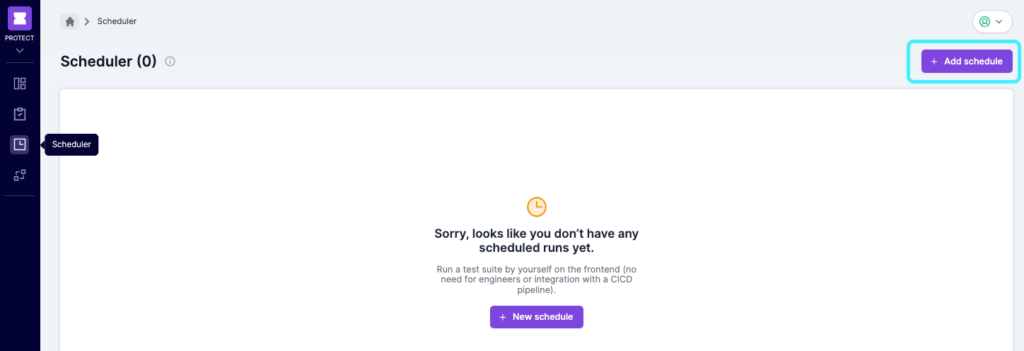
After you’ve defined your test suite using the steps above, you can schedule your test suite to run at a particular time, or on a regular basis. Click on the ‘Scheduler’ icon (a clock) in the left hand navigation bar. You can then click ‘Add schedule’ in the top right corner.
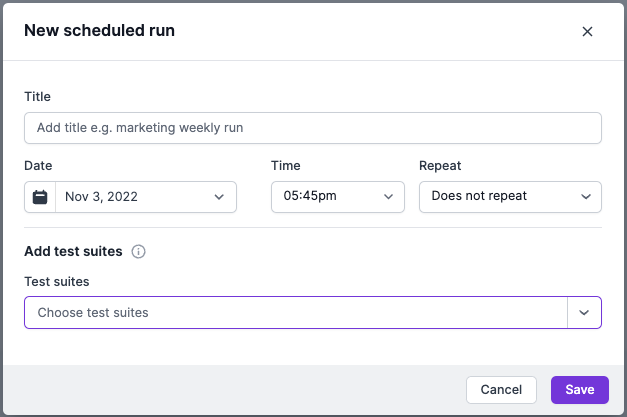
Simply give the schedule a title, select the date and time, set any repetition you require, and choose the test suites to include in the run.
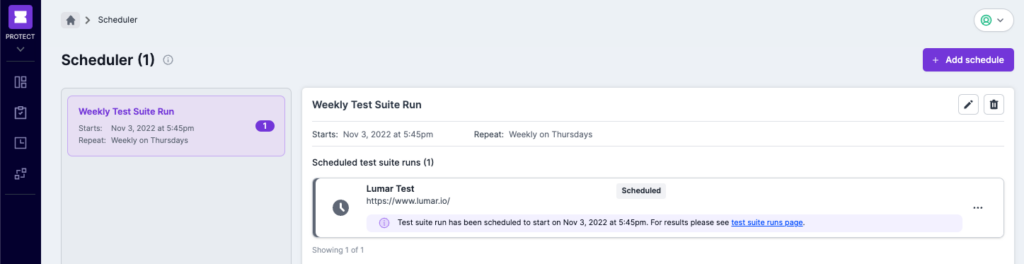
Once you fill in the details and click save, you’ll see the schedule in the Scheduler page.
Smart Thresholds
What are Smart Thresholds?
Once enabled, Smart Thresholds use the data from the previous five test runs to automatically adjust thresholds based on the worst performance from those tests.
For example, when you start running a test suite in Protect you need to either run it manually at least 5 times, or set it up on a schedule that runs at least 5 times. Smart Thresholds will then kick in after the 5th run. If the threshold was set at 200 broken pages and you fix some of those broken pages, bringing the total down to 120 Broken Pages, Smart Thresholds will change the threshold to 121 Broken Pages without any manual intervention on your part.
As your site continues to improve, we keep the threshold in line with it so you’re aware of any negative spikes on the site. If your Broken Pages remain over the set threshold, you will continue to be notified that this test Failed unless you manually set the threshold higher. This is to ensure that a critical alert doesn’t get missed.
Websites are obviously ever-changing, so Smart Thresholds can ensure your thresholds will be kept updated based on how your website is changing over time, without manual intervention.
When to use Smart Thresholds
Obviously you can use Smart Thresholds whenever you like. Like any automation though, it’s important to make sure it’s used efficiently. Automation is a great time saver for repetitive tasks that don’t require complex thinking, but when some errors in your site can lead to a significant loss of traffic or even revenue, your expertise is a vital factor in deciding on appropriate thresholds. For this reason, you may want to retain manual settings for the most critical tests for your site.
Fortunately, our Smart Thresholds can be enabled on a per test basis, so you may choose to enable it for those tests that result in a ‘warning’, but keep ‘fails’ that block the build manually set.
Of course you can also switch Smart Thresholds on and off at any time. This means you can turn them on to get a baseline for the thresholds, and then switch them off once that is set.
How to set up Smart Thresholds
In Step 3, where you add in the tests that you want to include in the test suite, you have the option to choose Smart Thresholds.
To get started, click on the ‘Use smart thresholds’ toggle at the top of the screen.
By default, ‘apply to all tests’ will be selected. If you’d like to use Smart Thresholds for the entire suite then you’re good to go. The Example platform will use data from the previous five crawls to automatically adjust the threshold.
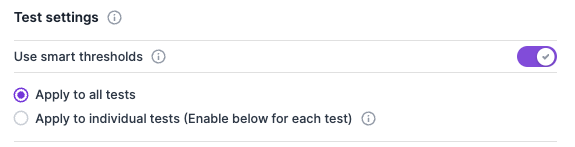
To enable Smart Thresholds for individual test suites, choose ‘Apply to individual tests’. You can then open the relevant tests to enable Smart Thresholds for only selected tests.
And if you change your mind, you can always disable Smart Thresholds whenever you like.


