Lumar Monitor is designed to drastically cut time spent monitoring multiple domains or large, complex websites. It helps you easily detect changes and trends that impact site performance, and identify where to focus your attention. Custom alerts give you notifications on the issues that matter most to you, while saving time and keeping notifications relevant with automatic updates to new thresholds based on previous crawl data.
Core benefits:
- Focus your attention and take swift action. Act quickly with custom alerts and a scannable overview of multiple domains or sections of your site in one place.
- Focus on the metrics that matter most. Avoid the noise with custom alerts that allow you to focus on the most relevant data.
- Spot trends and prove investment cases. Easily see when a metric is moving in the wrong direction, and provide evidence to secure investment.
- Save time spent manipulating data. Spot issues and trends from within Lumar. No need to download and manipulate data in spreadsheets.

Who is Monitor For?
Monitor bring benefits to a number of types of organizations, principally:
- Multi-domain brands. For organizations with multiple brands, it can be difficult to stay on top of accessibility issues for each brand site, and quickly identify issues trends. With a high-level overview of all sites in one place, you can get a quick view of how sites are performing, and quickly spot trends or issues that need addressing. Customized alerts also help ensure issues are quickly rectified.
- Large Websites and International Brands. For businesses with very large and complex websites, staying on top of all site areas can be just as challenging as managing multiple brands. With Monitor, you can see an overview of all the important parts of your site in one place, such as different product or content categories, or different geographies, so you can spot trends or issues in particular areas of your site.
- Agencies. Just like multi-domain brands, agencies also need to stay on top of accessibility issues for multiple brands, but for multiple clients as well as their own organization. With Monitor, agencies can easily track their customers’ websites for spikes or trends, and receive alerts of accessibility issues or trends that need addressing.
Creating Boards and Dashboards
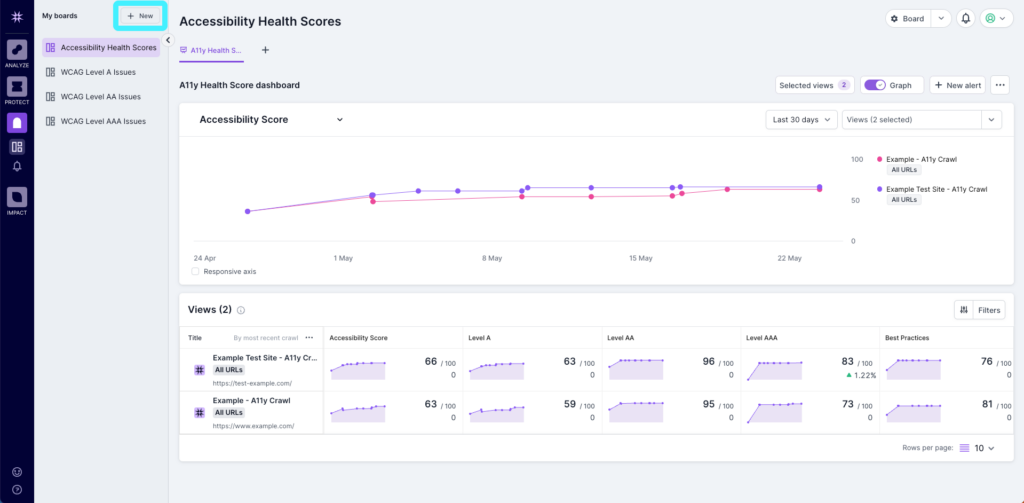
Once you’ve logged into Lumar Monitor, click ‘New’ at the top left of your screen.
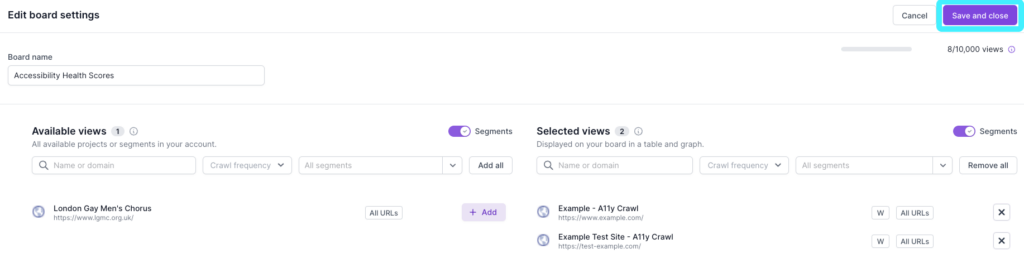
You’ll now see the ‘Create new board’ screen where you can give your new board a name. Underneath this you’ll see:
- Available views on the left hand side, which displays all of the views available across the whole account, filterable by project name or domain, segment name and crawl frequency. ‘All URLs’ indicates the entire project (i.e. no segment selected) whereas segment views will have the name of the segment indicated.
- Selected views on the right and side, which shows the specific views you have chosen to use in this board and any of its dashboards.
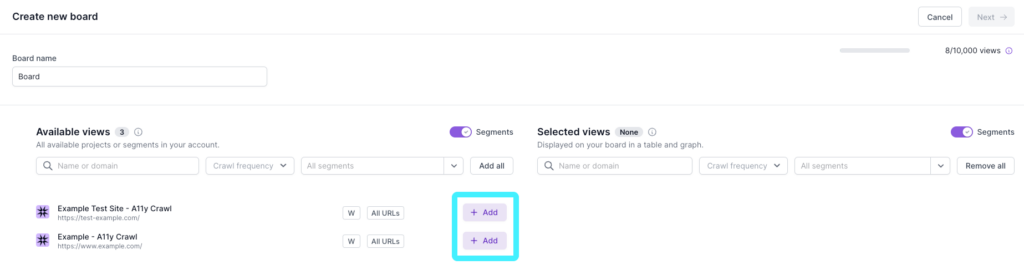
To select a view, simply click on the ‘Add’ button to move it from the available views list to the selected views list. By default, all views selected in the board settings will display on new dashboards, but you’ll be able to customize this later.
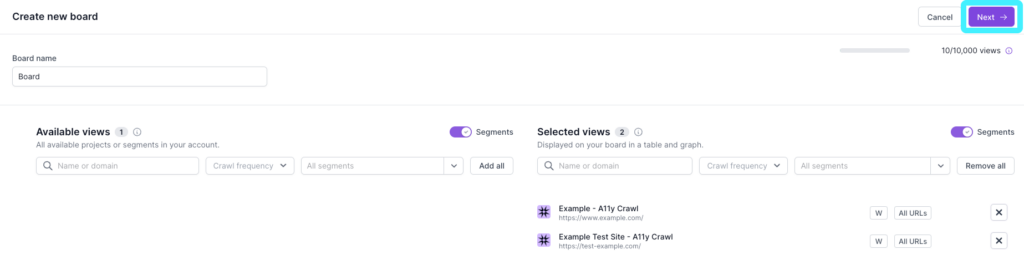
After you select your desired views, click on ‘Next’ at the top right of your page.
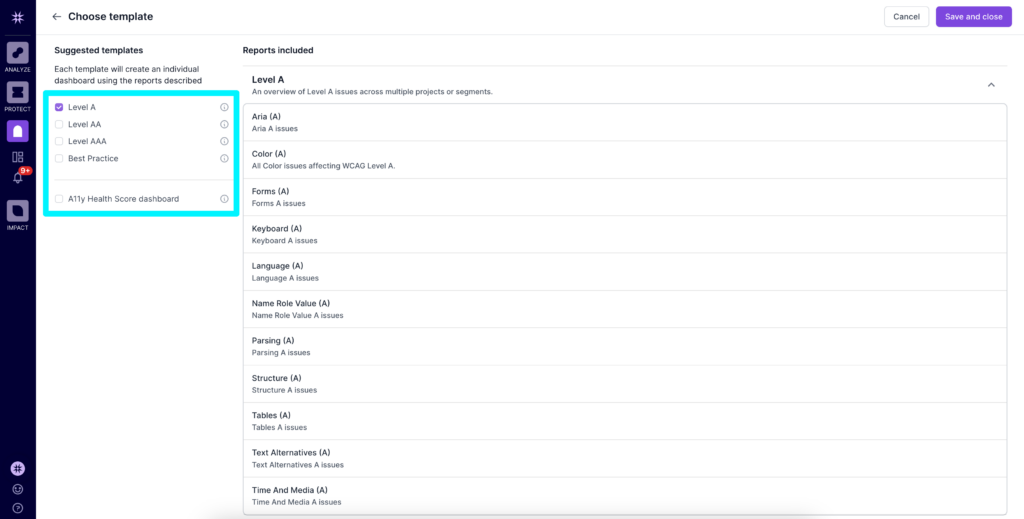
You’ll then see an option to choose a template. These have pre-set metrics that you can use to get started and customize rather than building a dashboard from scratch, to help save you time and quickly get up and running with Monitor.
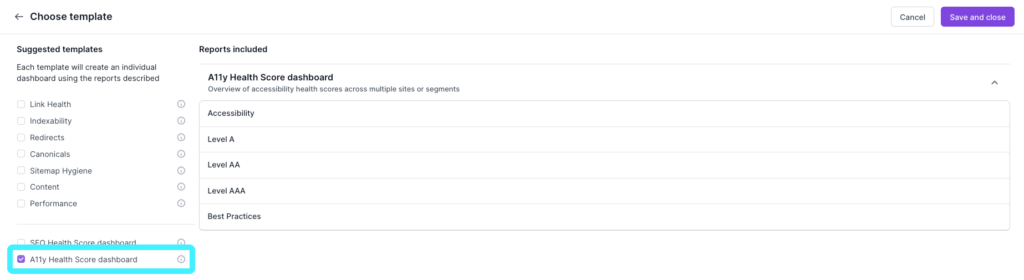
For accessibility, you can choose dashboard templates for WCAG Level A, AA, AAA and Best Practices. If you click to select one of the templates, you’ll see which reports are included. If you have health scores included in your subscription, you can also choose the A11y Health Score Dashboard on the left hand side by checking the box to the left of the template. This will create a dashboard with the overall accessibility health score, as well as the Level A, Level AA, Level AAA and Best Practices health scores.
Once you’ve selected the template, click ‘Create board’ in the top right hand corner of the screen.
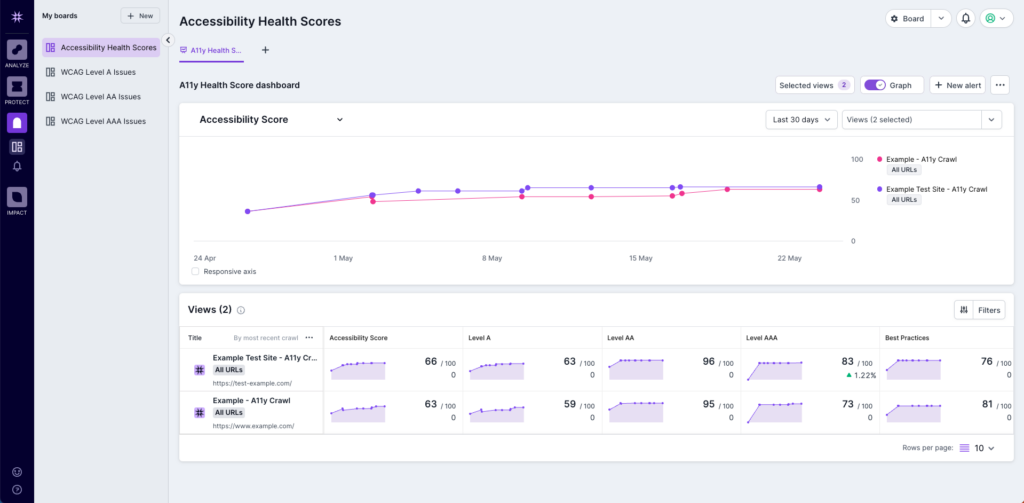
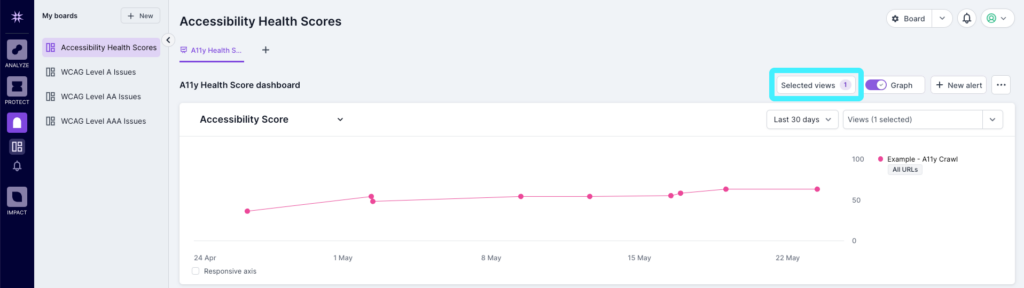
To customize each board, the “selected views” options allow you to show or hide views from the list selected in the board settings. Once this has been set, you can then choose which of the views you’ll see in the top graph.
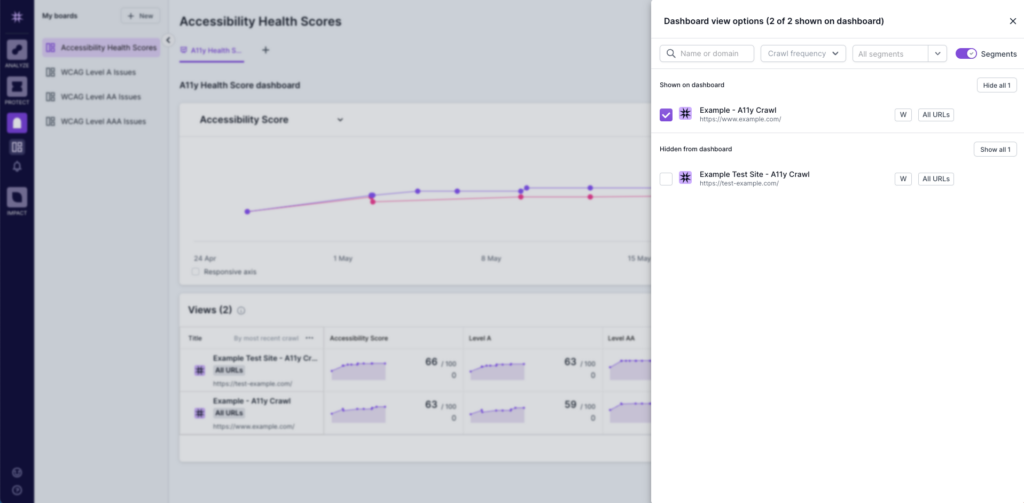
Within each board, you can create different dashboards that will show trend lines for selected metrics and each project. As new scheduled crawls complete in the platform, the data will become available in Monitor. Within each cell, you’ll see the following information:
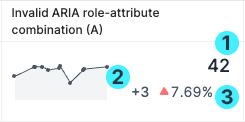
- The total number of pages in the last crawl for the relevant metric.
- The absolute change in the number of pages compared with the previous crawl.
- The % of difference in pages compared to the previous crawl.
Clicking on the relevant trend graph will take you to the corresponding report in Analyze.
Adding a New Dashboard Within a Board
Within each board you can then have additional dashboards. To create, click on the + sign at the top of the screen and choose ‘New report dashboard’.
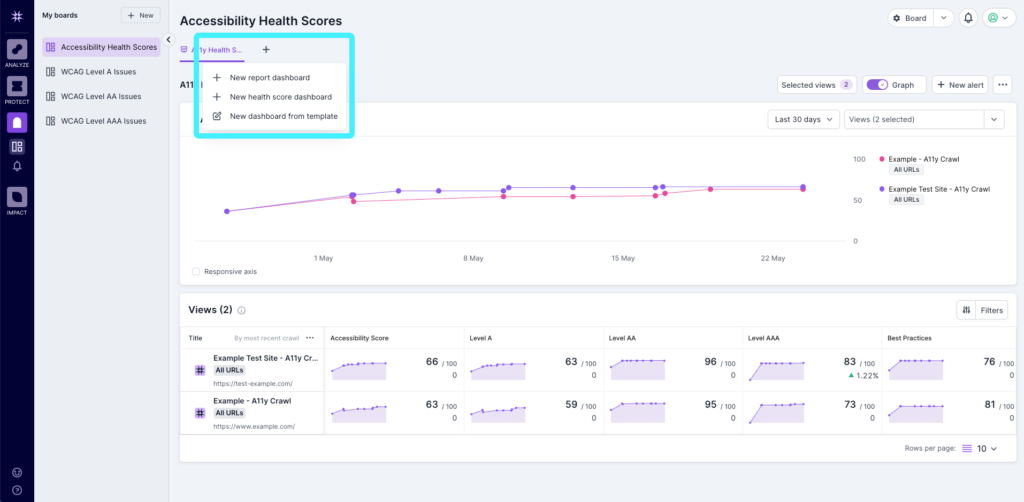
You can then give your dashboard a name and hit return (or click outside of the edit field) and the dashboard will create. You can then change the columns (see above) and change the metric in the top graph to reflect what you want to track in this particular dashboard. For example, you may want to create a board for WCAG Level A issues, and then dashboards for issues like ARIA, Color, Forms, Keyboard, etc.
Changing Columns
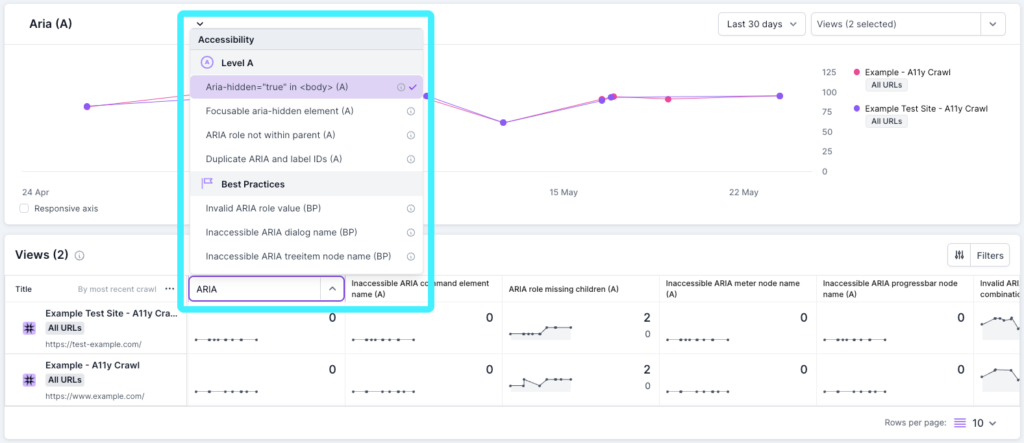
You can also change the metric that appears in table columns. Simply hover your mouse over the column you want to change and click ‘edit’. You can then choose from any of the default Lumar reports. You can choose up to 15 columns of metrics to appear in each row.
Adding or Removing a Column
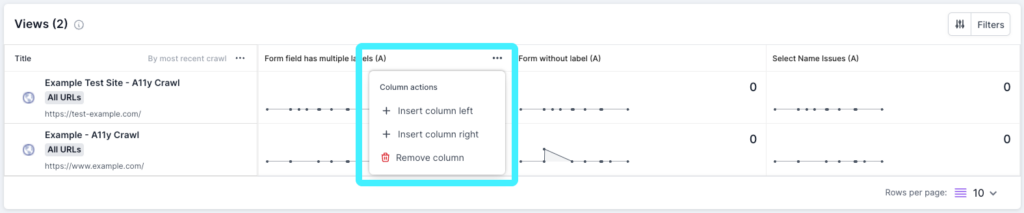
If you click on the three dots on the right of a selected column, you can choose to add a new column to the left or the right of the one you selected (up to a maximum of 15), or delete it all together (down to a minimum of 1). This gives you more flexibility in creating a dashboard view that serves you best.
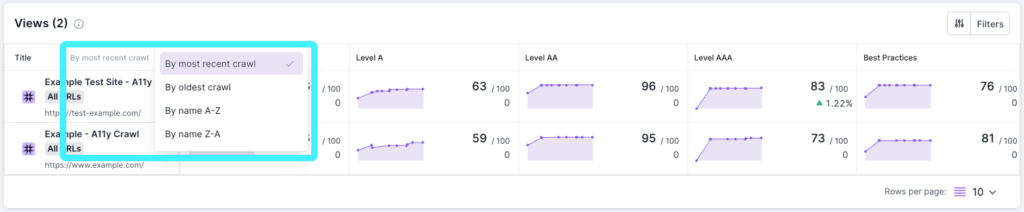
Sorting Views
You can sort the views list in the dashboard table by A-Z, Z-A or by the newest or oldest crawl. By default, this is set to the newest crawl. You’ll see how the list is currently sorted next to ‘Title’ on the left hand side, and can change the sort by clicking on the three dots next to the current sort description.
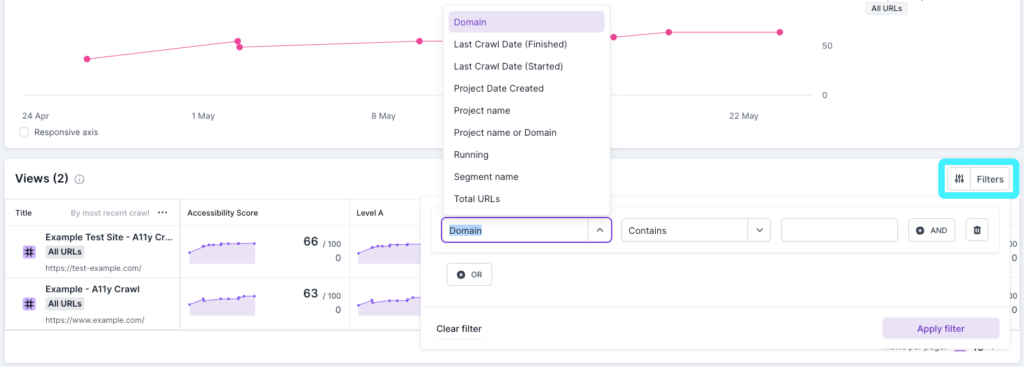
Filtering Dashboards
Click on ‘Filter’ at the top right of the dashboard table to access the filter options. You can use AND/OR tools to hone in on the specific data that’s important to you. For example, you can use this feature to filter the dashboard to a specific set of domains.
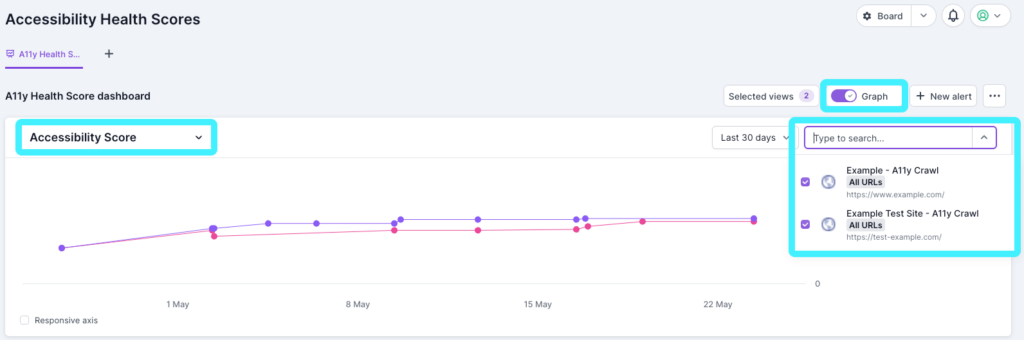
Comparing Metrics Across Views
At the top of the dashboard, you’ll see a toggle that allows you to switch on a graph to compare specific metrics across different views. Use the drop down in the top left of the graph to change the metric, and the drop down in the top right to select up to 10 views that will appear in the graph.
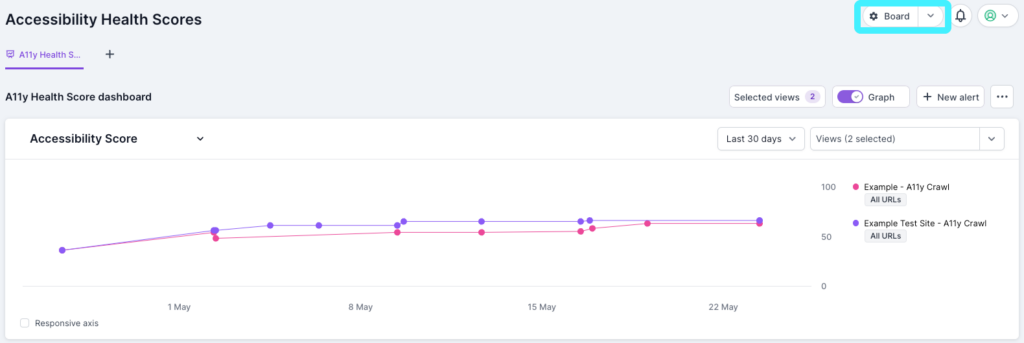
By default, the last 30 days will be shown on the graph, but you can change this to the last 7 days, last 90 days or last 6 months, using the options in the middle. One thing to note here is that we currently show 30 data points per trend, so when comparing different data sets it’s important to have crawls of similar regularity (i.e. daily or weekly) in the graph.
Renaming, Duplicating & Deleting Dashboards
To rename a dashboard, click on Board Settings at the top of the screen and you’ll be able to update the name of the board accordingly. Once you’re finished, just click ‘Save and close’ in the top right of the screen.
To duplicate a dashboard, go into the board that you want to duplicate, click on the down arrow next to Board Settings at the top right of the screen and select duplicate. From the same location, you can also delete a dashboard.
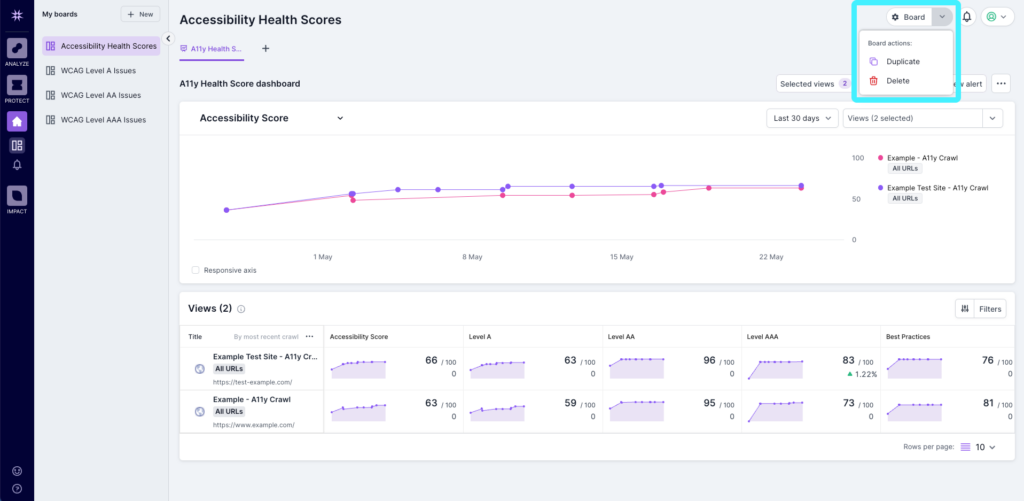
Monitor Health Scores
If Health Scores are part of your plan, you can now easily monitor them across your entire portfolio of websites, all in one place. This helps you direct your attention to where it matters most so you can prioritize effectively. Monitor allows you to create a Health Scores dashboard to give you a high-level overview of each of your websites’ technical health over these important areas:
- Overall accessibility score
- WCAG Level A
- WCAG Level AA
- WCAG Level AAA
- Best Practices