
The modern web is constantly evolving and JavaScript websites are becoming increasingly popular. At Lumar we have added new metrics and reports to help identify common JavaScript SEO issues.
Important: These new reports and metrics are only calculated when a crawl has JavaScript rendering turned on.
What is JavaScript SEO?
JavaScript SEO is an SEO practice that focuses on making JavaScript websites search engine friendly. There are a variety of unique problems that SEOs need to deal with to make JavaScript websites friendly for search engines. These common issues include:
- Rendering speed
- Main thread activity
- Conflicting signals between HTML and JavaScript
- Blocked scripts
- Scripts in the head
- Content duplication
- User events
- Service workers
For more information read our JavaScript SEO guide which covers everything you need to know about making JavaScript websites search engine friendly
What new metrics are available?
Lumar has a number of new metrics for those who have JavaScript SEO issues, including:
- Head Tags in Body Count – The number of <head> tags found in the <body> of the page.
- Body Tags in Head Count – The number of <body> tags found in the <head> of the page.
- Rendered Canonical Link Match – TRUE if the URL in canonical link in the rendered DOM matches the raw HTML canonical link URL.
- Rendered Word Count Difference – The difference of the word count found between the rendered DOM and the word count in the raw HTML of the page.
- Rendered Link Count Difference – The difference of the link counts found between the DOM and the raw HTML source of the page.
What new reports are available?
The rendering issue metrics can be found in the Config > Rendering.
Lumar has 4 reports which highlight JavaScript SEO issues.
Rendering Word Count Mismatch
Content is a critical element in ranking a page in search engine results. It is important to make sure that search engines can efficiently crawl and index content on a page. This report highlights the total difference in word count client-side (rendered DOM) and raw HTML (view-source).
Rendering Link Count Mismatch
Internal links are a crucial element of your website architecture. Using JavaScript to load internal links can cause a delay in search engines crawling and indexing content. Use this report to identify internal link count difference between client-side (rendered DOM) vs the raw HTML (view source).
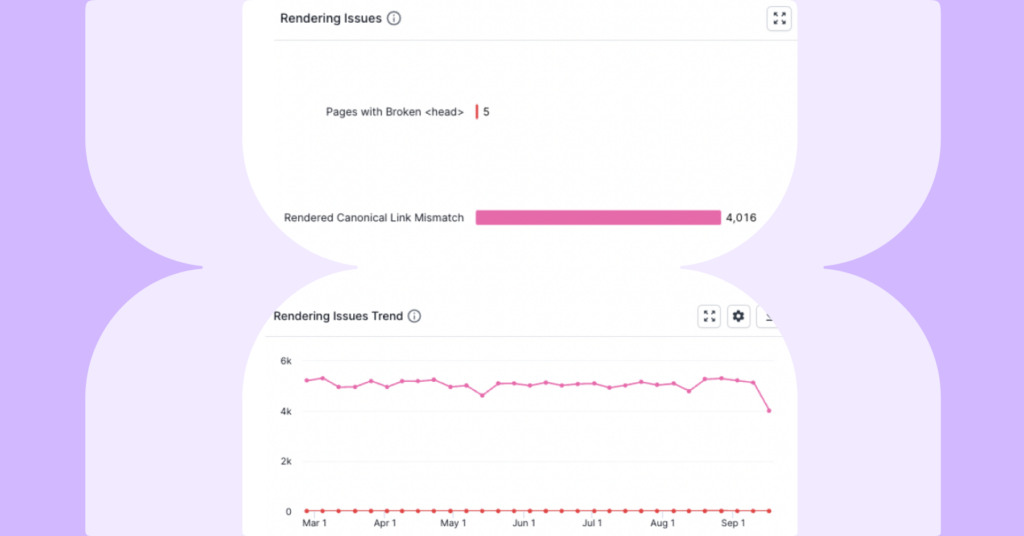
Rendered Canonical Link Mismatch
A canonical tag is a strong signal to tell search engines which page you want to be the primary version of your content. Use this report to identify pages with canonical tag URL mismatches in rendered DOM and the raw HTML source.
Pages with a Broken <head>
If invalid HTML tags (such as images, iframes, etc) can break the <head> early and cause important meta tags (canonical, hreflang, meta robots) to be ignored by Google. Use this report to identify pages with a broken <head>.
To learn more about this issue we recommend reading more about breaking the <head>.
How can I get started?
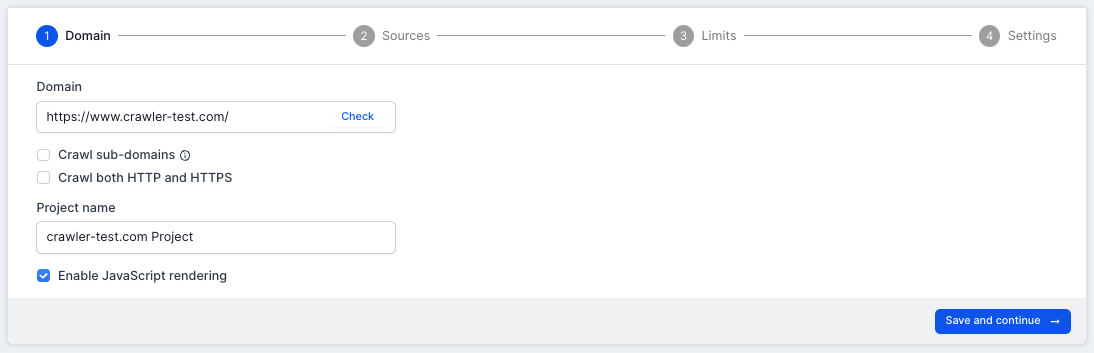
Any customer can access these metrics, all that is required is that the JavaScript rendering feature is enabled and the metrics will be captured in the next crawl. In the first step of the Project Settings, you can then check the ‘Enable JavaScript rendering’ box.
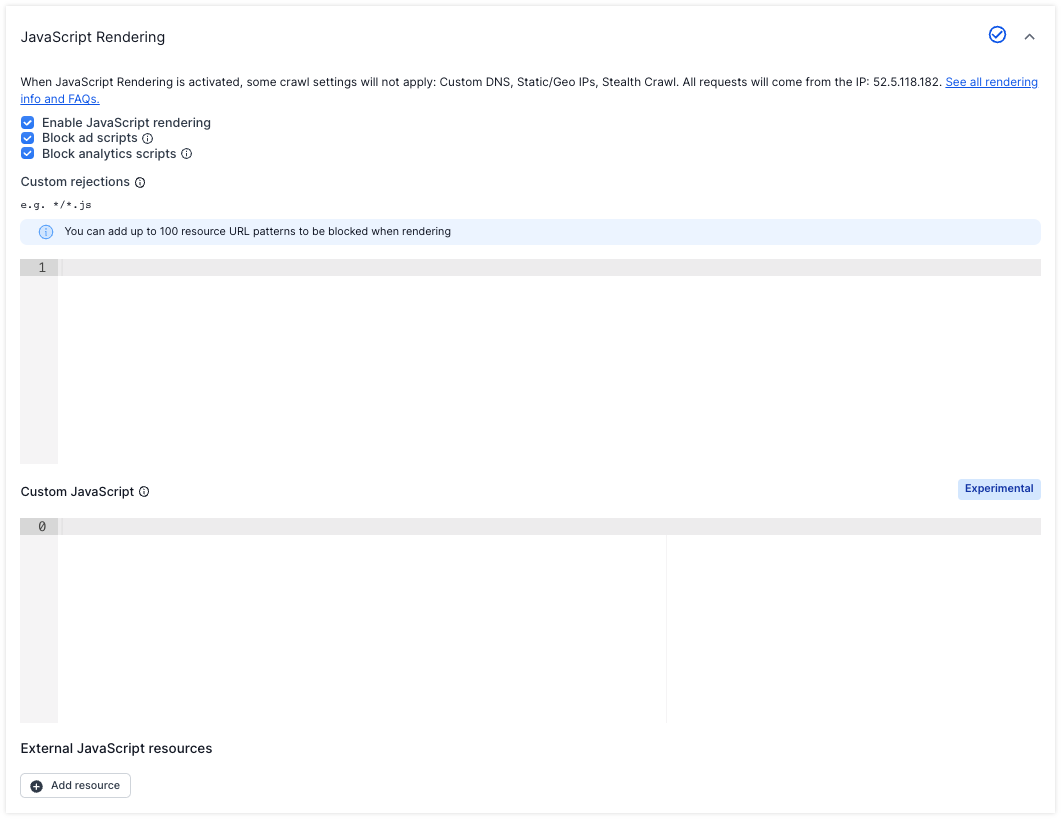
In step 4 of the project settings, you can also access additional settings for JavaScript Rendering using the Advanced Settings option, including adding any custom rejections or custom JavaScript.
Frequently Asked Questions
Will you be adding other JavaScript SEO issue metrics?
Our team will continue to monitor and gather feedback from our customers to identify any new JavaScript SEO issue metrics to our system.
Are these new reports available in the Google Data Studio connector?
Yes, all of these new reports are available in the Data Studio connector. If you have an existing data source or dashboard, you will need to go into the data source configuration and choose “Reconnect”
Will the new metrics and reports be available in the API?
Yes. Please read our API documentation to understand how to start pulling the data into your own workflows.
Summary
As always please share any feedback as this helps to improve Lumar. If you have any questions about these new metrics, please feel free to get in touch with our team.