
Monitor allows you to setup custom alerts, so you can be notified when core thresholds are breached. Alerts are available in-app, and also via push notifications to email, Slack and Teams.
Creating Alerts
Creating Alerts
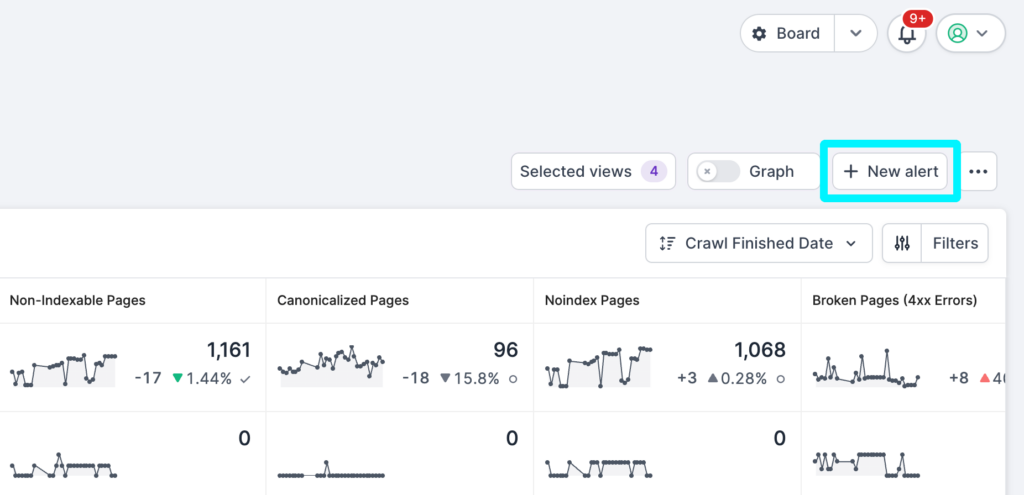
In the top right of the page, click on the ‘+ New alert’ button in the top right of the screen.
Choose the project that you’d like to set the alert for and you’ll be taken to the rules and thresholds settings, which will look like this:
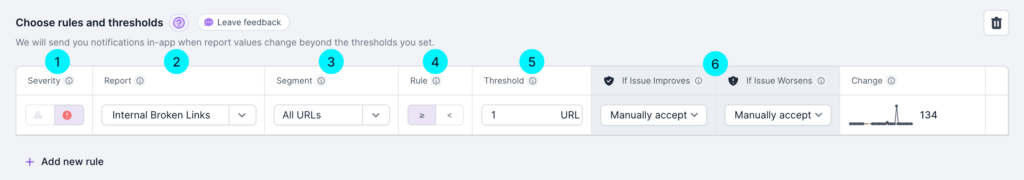
Here, you can now specify the settings for the threshold:
- Severity. Choose between a warning or critical alert. Warnings will be notified in-app, whereas any critical alerts will also come through as push notifications to email, Slack or Teams. This helps ensure you are only interrupted for the most critical issues.
- Report. Choose the report you’d like to set the alert for. You can choose from any of the default Lumar reports. Threshold.
- Segment. Choose to create an alert for a specific segment (from those you’ve set up in Analyze), or set the alert across all URLs.
- Alert Rule. Choose the rule for your alert logic. You can choose greater than or equal to, or less than.
- Threshold. Your URL threshold will be automatically determined based on your most recent crawl data. If you wish to overwrite this threshold with your own value, you can do so by choosing ‘greater than or equal to’ or ‘less than’, and then specify the number of URLs for the threshold. (Please note this will cause the threshold to no longer automatically recalculate the value. If you want to go back to the automatically set thresholds, you will need to remove the rule entirely and start again). To the right hand side, you’ll see the latest trend graph for the metric, with the current threshold as a red dotted line. As you amend the threshold the red line will update immediately to help you set an appropriate level. Here you’ll also see the total number of pages in the last crawl for the relevant metric, the absolute change in the number of pages and the % of difference.
- Smart Alerts. Here you can select if you would like Monitor’s Smart Alerts to automatically update thresholds based on previous crawl data. See below for more information on Smart Alerts.
Once you have created your first rule, you can add more by using the ‘+ Add new rule’ link underneath the existing alert/s. You can also easily edit the alerts by clicking onto the relevant alert and changing the settings – just remember to hit Save once you’ve made your changes.
Smart Alerts
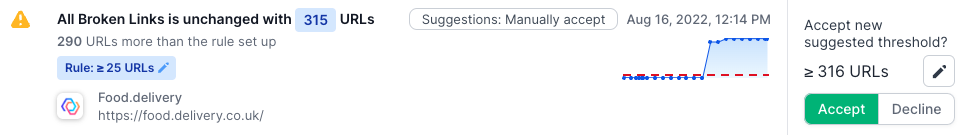
To keep alerts effective over time with minimal effort, Monitor’s Smart Alerts will automatically set new alert thresholds for you based on your recent crawl data. Alternatively, you can decide whether to manually accept or reject the new thresholds Monitor suggests. You can even choose to automatically accept new thresholds when an issue improves, but suggest when an issue gets worse, or vice-versa.
When an issue improves consistently, the alert threshold should be updated in-line with the improvements to prevent a gulf appearing between your initial threshold and the new level of your report (meaning you might miss new issues). So, if a threshold has not been breached in the past 5 crawls, Monitor will set or suggest a new threshold:
- For greater than or equal to rules, this will be the highest value from the last five crawls plus 1.
- For less than rules, it will be the lowest value from the last five crawls.
When an issue gets worse (i.e. when a notification is triggered) it may take some time to fix the issue. The alert threshold should be updated to the new status quo to prevent multiple alerts for an issue you’re already aware of, but still notify you if the issue gets even worse. So, if a notification is triggered, a new threshold will be set or suggested:
- For greater than or equal to rules, this will be the most recent value plus 1.
- For less than rules, it will be the most recent value.
If you have set Smart Alerts to automatically accept, the alerts will update and all new notifications will be at the new level.
If you are manually accepting Monitor’s suggestions, you can go through each suggestion and accept or reject as required. Accepted suggestions will be updated and all new notifications will be at the new level, while rejected suggestions will leave the threshold and notifications at the previously set level.
Editing or Deleting Rules and Alerts
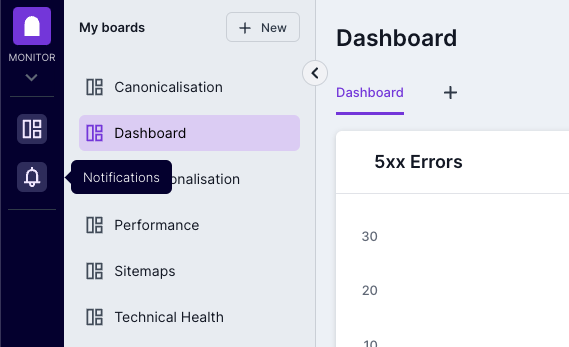
From the home screen, click on the Notifications icon in the left hand navigation.
This will take you to your notifications. In the top right corner of the screen, you’ll see an option to ‘Manage Alerts’. You can then choose the relevant project to make any changes to the rules for that alert.
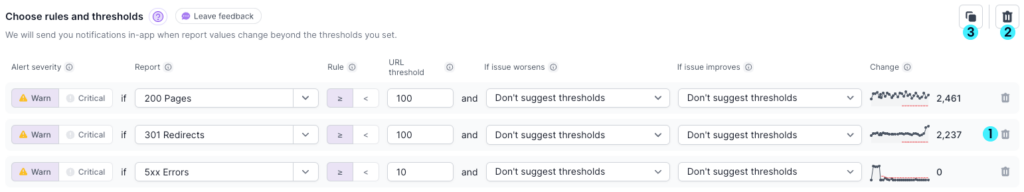
- Use the trash can icon next to the relevant rule to delete that rule.
- To delete the entire alert, use the larger trash can icon at the top.
- The ‘Copy to’ option allows you to copy all rules to another project. Just choose the project you want to copy to. If there are already rules in the project you’re copying to, the new rules will be added to the project alert. If a rule already exists for a specific metric, the new rule will be prioritized over the existing one, and overwrite it
Actioning Alerts
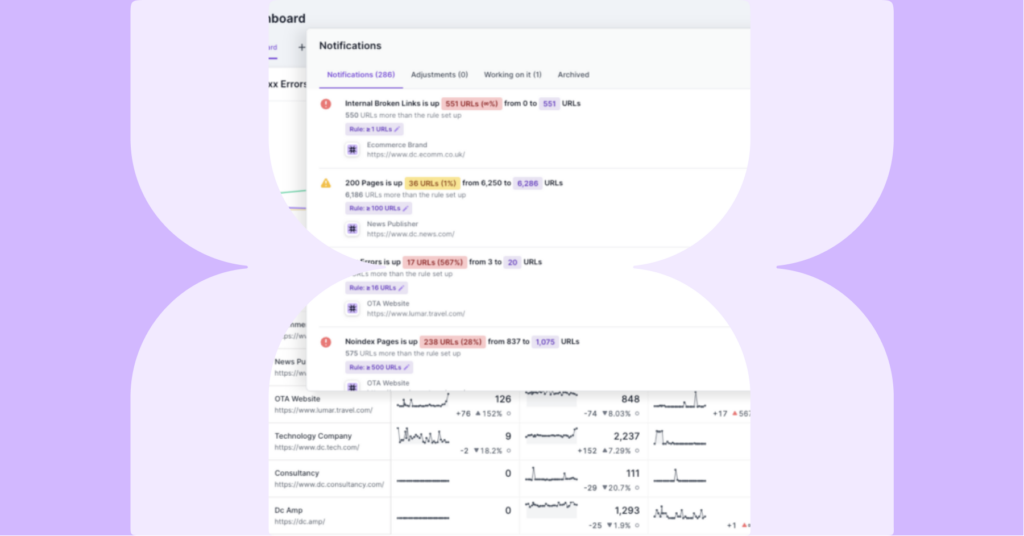
To access your alerts, click on the Notification icon in the left-hand navigation. This will take you to a summary of your notifications.
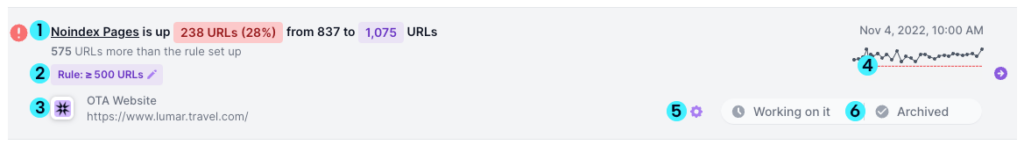
- Information about the alert the notification relates to. This includes the metric affected, the change from the previous crawl (in absolute numbers and percentages), and the number of URLs in relation to the rule settings.
- The rule that is triggering the alert. You can use the pencil icon to edit the rule.
- The project the notification relates to.
- On the right hand side, you’ll also see a summary of information, the trend graph for previous crawls and the date and time of the notification.
- Clicking the gear icon will take you to the manage alerts page.
- You can also mark the notification as ‘Archive’ or ‘Working on it’ so other people seeing the notification know if it has been actioned.
From the alerts screen, you can click into the main body of the notification to be taken to the relevant report in Analyze, so you can quickly see more information and diagnose the issue.
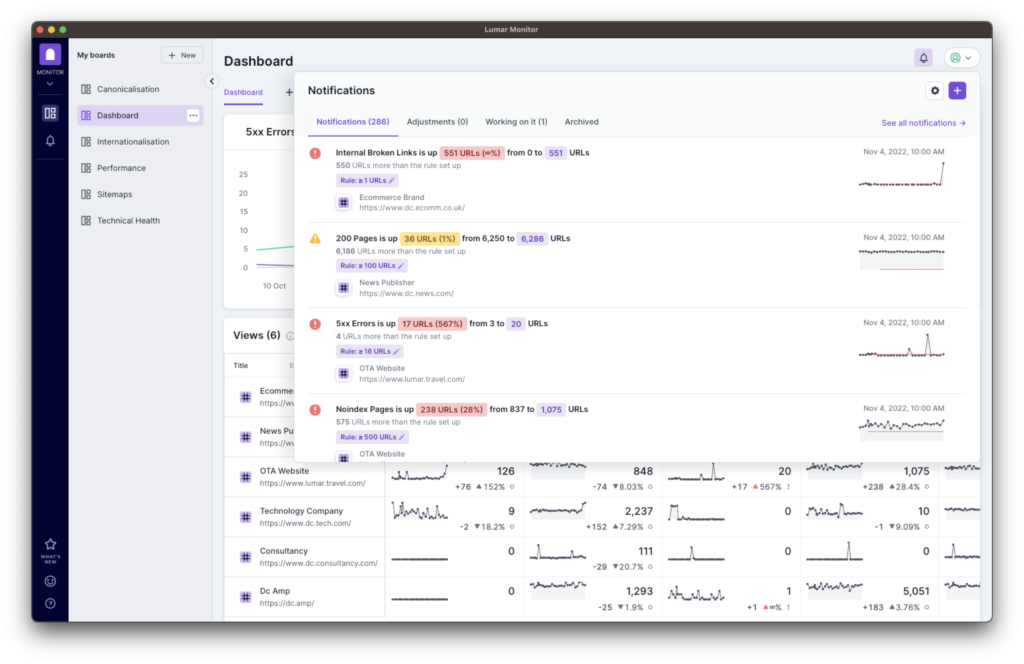
You can also see notifications by clicking on the notification in the top right corner of the dashboard screen.


