

Chapter 1: The Importance of Site Speed
It is vital to improve site speed and performance for user experience. In order to do this you’ll need to know the state of your site as well as which metrics you need to analyse. To understand where potential roadblocks for site speed could lie, let’s start by looking at the process of website loading.
Where loading happens
For web scripts, there is a clear split between where they run and whose job it is to handle them. They either run server-side, which, as the name suggests, is the server that hosts the site on the back-end, or they run client-side, which is the browser where the user accesses the site on the front-end.
Front-end scripting is good for anything that requires user interaction, such as a simple game. Back-end scripting is good for anything that requires dynamic data to be loaded, such as a notice that tells the user they’re logged in.
Server-side
Server-side languages are loaded first before anything else happens. All of this work is done behind the scenes on the hosting server, and the browser will make a request to the server for the website’s content afterwards. Each time a page is accessed, where a cached version isn’t available, a request will be made to the server and the page will be rendered in full.
Here are some examples of server-side languages:
- PHP
- Ruby
- ASP.NET
- C#
- Python
Performance impact: Server-side performance depends on factors such as the server’s location, how many sites it is hosting (if it’s a shared server), how many users are trying to access it at any given time, and the server hardware and its capabilities, especially memory, HDD (Hard Disk Drive) storage and CPU (Central Processing Unit) power. Also, server-side rendering may provide visuals quicker, but users can be left trying to interact with a page without success as the browser hasn’t yet rendered the required elements.
Benefits: The more the server loads, the less work the browser and the user’s device need to do, which can be great for speed improvements.
Server-side rendering is great for SEO because your content is present before you get it, so search engines are able to index it and crawl it just fine.
Client-side
Client-side languages can cause noticeable performance issues because these are the ones that run on a user’s device after a page has been loaded. The server has done all it can with the initial request and response, and handling the rest of the experience is down to the browser. Client-side languages are most useful for anything involving user interactivity.
Here are some examples of client-side languages:
- HTML
- CSS
- JavaScript (including frameworks such as Angular, Vue and React)
Performance impact: Hardware limitations of the user’s device come into play with client-side rendering. The CPU of the average mobile is very small compared to desktop which means it can take a long time to load scripts like heavy JavaScript. SEO performance can also take a hit because with this setup content being visible depends on the browser, so the search engines may struggle to see client-side-rendered content.
Spot the date when this website, that was 100% reliant on client-side JavaScript rendering, implemented a server-side rendering solution.
Still a lot of work to be done, but now at least we can start doing proper SEO knowing that Google will actually crawl & index it. #TechSEO pic.twitter.com/wFVqTknO8T
— Barry Adams (@badams) May 29, 2018
Benefits: When rendering happens in the browser, this puts less of a strain on the server because you have to make fewer requests to load entire pages. There is also more scope for creating interactive, engaging elements for users.
As the web becomes more interactive, client-side rendering is becoming more prominent. However, we need to be aware of the crawling and speed issues that come with it.
The key things to look out for and consider here for both rendering methods are too many server requests, and whether content can be rendered client-side.
The key performance metrics explained
Once you look beyond aggregated, simplified scores provided in page speed tools, you will start to see just how many site speed metrics there are to wrap your head around. With so many different acronyms like TTFB and FCP being thrown around, it can be easy to get lost.
Site speed isn’t as simple as having an A grade, or an 85% score. You need to look at the entire picture: what are the actual metrics that make up your site’s performance?
We’ve put together a list of the site speed metrics and definitions you need to know about, as well as what they mean and measure:
- Server Response Time
- Time To First Byte (TTFB)
- DOM Interactive
- DOM Content Loaded
- Page Load Time
- Fully Loaded
- First Paint
- First Contentful Paint (FCP)
- First Meaningful Paint (FMP)
- Hero Element
- Speed Index
- Visually Complete (VC)
- First Interactive
- Time To Interactive (TTI)
- First Input Delay (FIP
- Consistently Interactive
- Long Tasks
Server Response Time
Server Response Time measures the time needed for the required HTML to be loaded for the server to then start rendering it. Server Response Time looks at back-end latency.
Highly variable server response time may indicate an underlying performance issue.
Time To First Byte (TTFB)
Time To First Byte (TTFB) measures the time taken between the client making a request to the server and then receiving the first byte of data in the browser. This metric provides an overall view of server-to-client responsiveness.
TTFB helps enterprises identify weak points in the connection process.
DOM Interactive
DOM Interactive measures the point when the DOM (Document Object Model) has been constructed by parsing all of the HTML and is ready.
The DOM represents the document (or page) as nodes and objects. That way, programming languages can connect to the page.
–MDN
DOMContentLoaded (DCL)
DOMContentLoaded (DCL) measures the time taken for the initial HTML document and the content of the DOM to be fully loaded and parsed, except for elements like images and iframes, for example.
One of the main reasons we’ve historically optimized for metrics like load and DOMContentLoaded is because they’re exposed as events in the browser and easy to measure on real users.
In the last three years, DOMContentLoaded has gone down on desktop but has seen a rise on mobile.
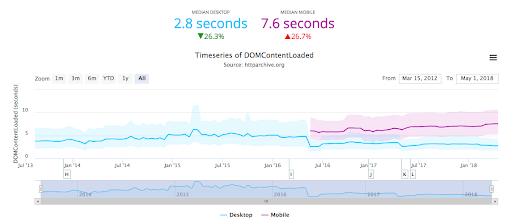
Source: HTTP Archive
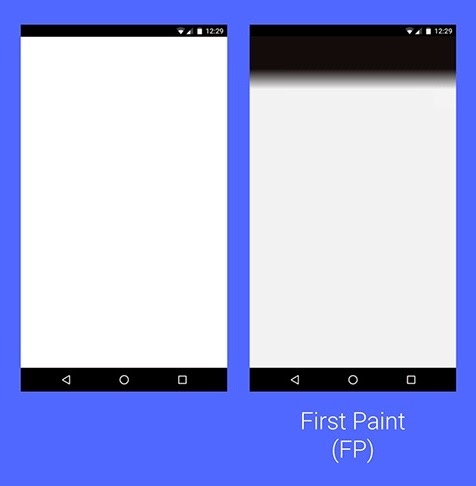
First Paint
First Paint is when the browser starts to render the page and shows the first hint of content on the screen. This is a good front-end benchmark of when a page appears to be starting to load.
First Paint is triggered when a render – any render – is detected in the browser. This could be something as subtle and uninformative as a change in background colour.
First Contentful Paint (FCP)
First Contentful Paint (FCP) occurs when the browser renders the first element of content defined in the DOM, such as some text, an image or a section of navigation, for example.
This timing aims to be more representative of your user’s experience, as it flags when actual content has been loaded in the page, and not just any change.

First Meaningful Paint (FMP)
First Meaningful Paint (FMP) marks the time when the biggest change in the above-the-fold layout has happened and the most important elements of a page are visible, such as your hero element.
The time at which the user feels that the primary content of the page is visible.

Hero Element
When the most important element or key feature of your page has rendered and is usable. For example, the Hero Element on YouTube would be the main video you want to watch.
In the context of a single page or a single application, it’s generally best to consider FMP to be the moment when your hero elements are visible on the screen.
Speed Index
The Speed Index is the score given to a page based on a variety of different speed metrics, which basically times how long it takes to display the visible elements of a page in milliseconds. Patrick Meenan defines this metric as a weighted average of the paint timings and how long it takes for content to be displayed to a user.
A page load performance metric that shows you how quickly the contents of a page are visibly populated.
Visually Complete (VC)
Visually Complete (VC) is when all above-the-fold content is visible in the user’s browser. This will be when the user perceives the page to be loaded, as everything within their viewport has been rendered.
For Visually Complete, content “below the fold” and non-visual content (like third-party tracking beacons) is excluded.
First Interactive
First Interactive measures the time when a page has finished loading to the point that the user is able to start minimally interacting with it.
The page responds, on average, to most user input in a reasonable amount of time.
Time To Interactive (TTI)
Time To Interactive (TTI) measures the point when a page is both visually rendered and able to respond to user actions or input more reliably.
The time at which a page appears to be ready enough that a user can interact with it.
TTI measures how long the browser takes to respond to interactivity, but the next metric measures how long the user has to actually wait for this delay.
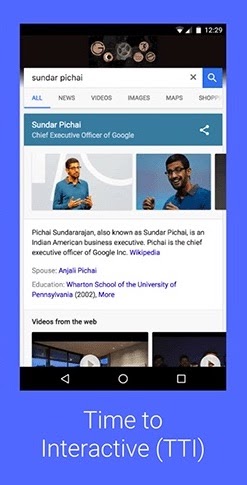
Source: Google Developers
First Input Delay (FID)
First Input Delay (FID) was released by Google to take user experience measurement one step further and look at interactivity in more detail.
First Input Delay (FID) measures the time from when a user first interacts with your site (i.e. when they click a link, tap on a button, or use a custom, JavaScript-powered control) to the time when the browser is actually able to respond to that interaction.
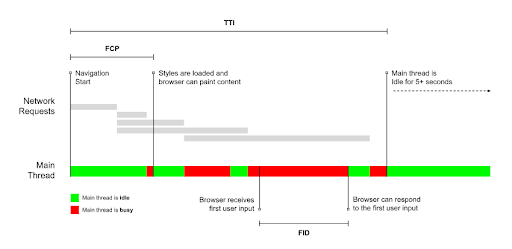
Source: Google Developers
This chart shows that the browser can’t respond to input until the main thread has finished loading elements like CSS and JavaScript, so this is where FID comes in to measure the gap between the user’s readiness and the browser’s readiness.
Consistently Interactive
Consistently Interactive measures the time taken until the page can always be expected to be responsive to a user’s input and interactivity.
The Consistently Interactive metric measures when a page is fully interactive.
Long Tasks
Long Tasks occur when a user is interacting with the browser and adding input which all has to be added to a queue on the main thread, because each task has to executed one at a time.
To the user this appears as lag or jank, and it’s a major source of bad experiences on the web today.
Page Load Time
Page Load Time is a broad metric that measures the time it takes for the entire content of a web page to be downloaded and displayed in the browser.
There are many different factors that affect page load time. […] The hosting server, amount of bandwidth in transit, and web page design – as well as the number, type and weight of elements on the page. Other factors include user location, device and browser type.
Fully Loaded
Fully Loaded marks the point when the page has finished loading, including content, images and any activity triggered by JavaScript on the main page.
Fully Loaded is measured as the time from the start of the initial navigation until there was 2 seconds of no network activity after Document Complete.
The full journey of a page loading
To demonstrate how these metrics work in the context of a page loading for a user, here are some charts showing the process in action:

Source: GTmetrix
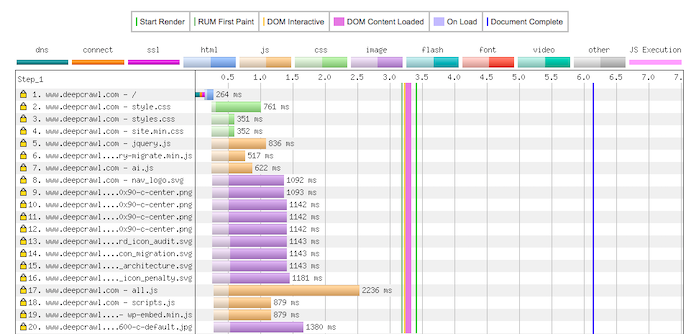
Source: WebPagetest
A waterfall chart, like the one above from WebPagetest, is a great way of visualising the page load process and all the different elements involved, and it allows you to quickly spot the biggest problem areas across each resource at each stage of the loading journey. It also helps you visualise dependencies and loading priorities.
Artificial vs Real World Measurement
Now that we’ve looked at the metrics that make up a page’s performance, let’s think about how you would go about testing them. Site speed measurement is often split into two main methods: Synthetic Testing which is performed in a lab environment, or Real User Measurement (RUM) which monitors actual user experiences as they happen in the real world.
Here are some of the main benefits, limitations, metrics and tools for each of these methods.
Synthetic Testing:
- Stable – more detailed and reliable measurements which is good for competitor benchmarking.
- Requires “representative” configuration – in the way that one persona represents a variety of different people.
- The key metrics – First Contentful Paint, Speed Index, First Interactive.
- The tools – Lighthouse, WebPagetest, GTmetrix, Pingdom.
Real User Measurement (RUM):
- Actual performance – although this is highly variable and changes depending on the person, device, location etc.
- Limited competitive analysis – it’s difficult to do benchmarking.
- The key metrics – First (Contentful) Paint, First Interactive.
- The tools – Google Analytics, mPulse, New Relic.
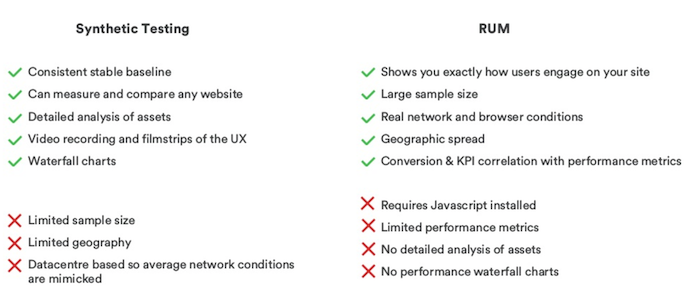
Source: María Camañes Forés
Having a stable set of performance data to be able to compare against your competitors may sound great for setting benchmarks and baselines. However, some of the most meaningful optimisation work you can do will be for your actual users, so measure performance for them in the first place.
To help reduce some of the many possible user variables for RUM testing, you should select some real world profiles or personas to test. Here are some example groups that Patrick Meenan recommends looking into:
- “My site isn’t that slow”
- CrUX effective connection type
- GA and RUM connection info
- Slow users under-represented
- Median and 99+ percentile
Lab testing can give a baseline idea of site performance, but without real world testing you’re missing the heart of what measurement should be about: the user and their pain.
The Google team gave a good explanation of the importance of RUM when discussing why two similar interactivity metrics are used, TTI and FID:
TTI is a metric that can be measured without any users present, which means it’s ideal for lab environments. […] Unfortunately, lab metrics, by their very nature, cannot measure real user pain.
FID, on the other hand, directly represents user pain—every single FID measurement is an instance of a user having to wait for the browser to respond to an event.
For these reasons we recommend both metrics, but we recommend you measure TTI in lab and you measure FID in the wild, with your analytics tool.
With the launch of the Chrome User Experience report which shows actual Chrome user data for a large collection of websites, it is now possible to benchmark performance against competitors with measurements from real users rather than only being able to use lab testing for this. You can access this data using BigQuery. Take a look at how this resource was used to compare user experience data between Amazon and Walmart:
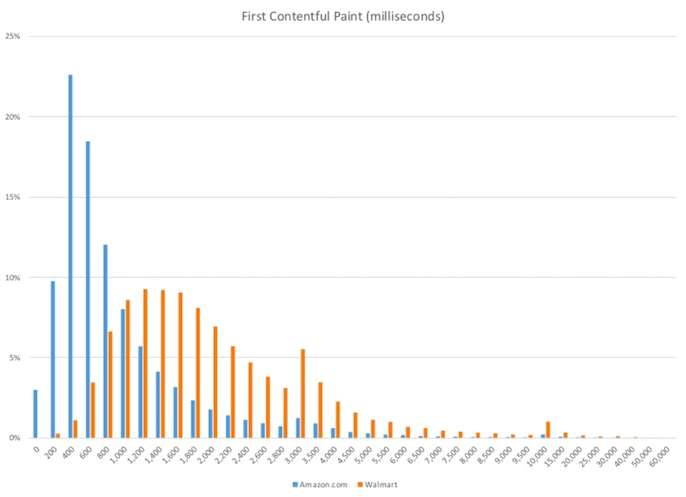
Source: Patrick Meenan
Measurement should be an evolving process that feeds into your SEO and performance strategies. Ideally, this is how Google recommends the entire journey of performance optimisation should flow in order to track and prevent any experience regressions as you are testing and making changes, with synthetic testing and RUM being used together for the best possible user experience:
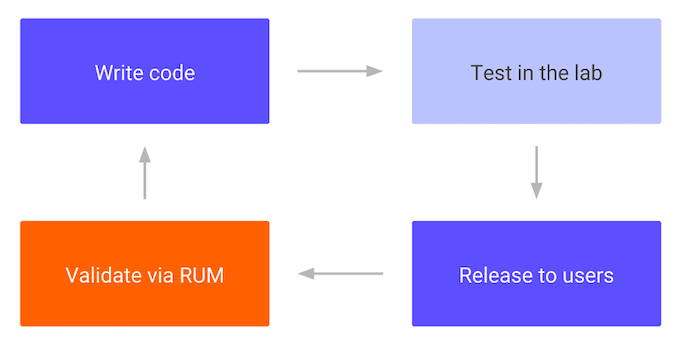
Source: Google Developers
The most important site speed metrics
The next step is to prioritise the metrics that matter most. Priorities will vary depending on each business, its website and customers, however, considering what matters most to users and search engines alongside your own business will help you figure out what’s most important.
Nothing should make the dev queue that isn’t good for customers, good for Google and good for business. Two of the above are not enough. AMP only ticks one of these boxes – good for Google. But speeding up the site you’ve spent years researching, creating and optimising is win-win-win – and should be the absolute number one thing on your priority list.

Which metrics matter most for the user?
Specific back-end metrics like TTFB won’t matter to the user; they only care about what is happening on the screen in front of them in terms of what is visible and usable.
To help you think about a user’s key expectations and the metrics needed to meet them, Google has a useful way of splitting out performance metrics depending on where they feed into the user’s experience.
“Is it happening?”
- When pixels are rendered to the screen, this is an indication to a user that something is happening.
“Is it useful?”
- The most important elements of a page need to be visible in order for a user to find it useful.
“Is it usable?”
- A page must be able to handle input and engagement before a user will consider it usable.
“Is it delightful?”
- The user won’t have a positive experience if tasks are being queued up and taking a long time to be completed.
It’s really important to analyse the right performance metrics and categorise them depending on which area they feed into, whether it’s technical, visual or interactive. This is really helpful for narrowing your scope and deciding what optimisation work to prioritise depending on your business’ focus area.
Technical metrics:
- Time To First Byte
- Server Response Time
- DOM Interactive
- DOM Content Loaded
- Page Load Time
- Fully Loaded
Visual metrics:
- First Paint
- First Contentful Paint
- First Meaningful Paint
- Speed Index
- Visually Complete
Interactive metrics:
- First Interactive
- Time To Interactive
- First Input Delay
- Consistently Interactive
What are Google’s site speed considerations?
In the immediate future, you won’t have any trouble from Google in terms of rankings unless you have a really slow site.
Google splits out sites with OK and very slow load times.
-John Mueller, Google Webmaster Hangout
However, it’s not all about Google’s current algorithms. You can’t neglect performance for your users, because they are the most important judges of your website and its worth. Your users are the ones that are going to wait for your site to load and buy from you, or not. This is becoming more and more apparent as Google puts more of a focus on measuring user experience.
Google wants us to take more notice of speed and site performance, because even if it isn’t a major ranking signal yet, it is a major problem for users now.
If you ask Google which metrics you should be looking into for performance improvements, you will be advised to look beyond individual factors and understand how your site performs in the real world for users.
This was confirmed in a tweet by Google Webmaster Trends Analyst, John Mueller.
I wouldn’t focus on a single metric. We recommend using a broad set of real-world user experience metrics, as no single metric can represent a user’s experience with a page. These can be useful: https://t.co/EVxjpP0AqK & https://t.co/WIZXilMH2Z
— ???? John ???? (@JohnMu) May 21, 2018
Assessing site speed and performance by looking at individual metrics is a misrepresentation of reality; results will always vary depending on the user.
This has also been demonstrated in the updates Google have made to their PageSpeed Insights tool to include more real world data as part of optimisation scoring and recommendations. Google will also be taking anonymised speed data from Chrome to factor into their speed calculations; which is yet another reason why optimising for users is important.
For any successful performance optimisation work to be carried out, you need to have a clear understanding of how users actually access and experience your site. “What device are they using?” “What are their network conditions like?” These are the real questions you need to be answering, instead of “How’s the PageSpeed Insights score looking?”
Google did a great job of explaining this point:
Load is not a single moment in time—it’s an experience that no one metric can fully capture. There are multiple moments during the load experience that can affect whether a user perceives it as “fast”, and if you just focus on one you might miss bad experiences that happen during the rest of the time.
Advancements in Lighthouse
To help you better capture and analyse those bad experiences, Google has added a number of new reports to its Lighthouse tool to try and give us a better understanding of what’s happening client-side.
These are some of the key reports to try out:
- JavaScript Boot-up Time is High
- Unused JavaScript
- Use Video Formats for Animated Content
- All Text Remains Visible During Web Font Loads
- Optimize Images, Offscreen Images & Oversized Images
If you want to learn how the Google team used Lighthouse to improve a website performance score from 23 to 91, read this step by step guide.
Chapter 3: Site Speed Optimisation Best Practice