Site performance (including site speed and Core Web Vitals) has always been a hot-and-cold topic in SEO circles. It may not be the single factor that propels your site to the top of the rankings, but its impact on user experience and crawl efficiency makes it essential for SEOs and digital marketers to understand and optimize.
At its core, site performance on its own rarely drives dramatic ranking changes. In extreme cases — for example, a very slow website — improving performance can bring noticeable benefits. But for most sites, faster speed alone won’t vault you to page one. So, why should performance be important to you as an SEO?
Why Site Speed & Performance Still Matter for SEO
It boils down to two things:
- Users are far more likely to engage and convert on a site with good performance.
- Google is much more likely to crawl more pages of a fast-responding site.
The first point is kind of obvious… slow load times correlate strongly with users abandoning their visit (or cart!). If you’ve ever been on a site where content jumps around or pages take ages to load, you know how frustrating it is.
In fact, Google research found that as page load time goes from one second to 5 seconds, the probability of a mobile site visitor bouncing increases by 90%.
The second point is less obvious but equally important. Sites with slower response times typically have fewer pages crawled on average than faster ones. Improving response time can indirectly boost your visibility by letting Googlebot discover and refresh more URLs.
We’ll break down what “performance” actually means below, starting with Core Web Vitals.
For now, the key takeaway is simple: website performance is ultimately about users — and that’s why it matters for SEO.

Core Web Vitals: The Most Common Website Performance Discussion Point
One of the most frequently discussed aspects of website performance is Google’s Core Web Vitals.
Core Web Vitals are interesting because Google has indicated that they directly affect rankings. When Google publicly highlights a ranking factor, it’s usually to encourage all site owners to improve in that area.
Core Web Vitals (CWV) break down into three key metrics:
- Largest Contentful Paint (LCP): how long it takes your main content to load.
- Cumulative Layout Shift (CLS): how much elements move after the page loads.
- Interaction to Next Paint (INP): how quickly the site responds to user interactions.
An important point about Core Web Vitals: these metrics are based on real user data from Chrome, so a page won’t have any values if not enough people visit it using the Chrome browser.
This is vitally important to understand because what is quick for a server to do might be painfully slow for a user on a mobile network.
Improving LCP (Largest Contentful Paint)
LCP issues are typically server-related. It’s rare for LCP issues to be isolated to just one element on a page, so if your main content is taking a long time to load, chances are you’ll have speed issues across other elements on the page as well.
On CMS platforms like WordPress, bloated plugins are often the main culprit of poor LCP scores. More complex sites may suffer from slow database retrievals or caching problems.
To improve your LCP score, investigate these bottlenecks to reduce time to first render for your primary content.
Reducing Cumulative Layout Shifts (CLS)
CLS problems usually are down to poor web space definition. Specifically, when you have an element load onto a page without having defined the space it is going to use, which leads to everything else getting pushed around on the page. This leads to users clicking on the wrong items and is generally very frustrating as a user experience.
Typically, CLS issues can be solved by defining the dimensions of elements like images, ads, or embeds, so even if they load slowly, it won’t disrupt the rest of the page layout.
Optimizing Interaction to Next Paint (INP)
INP, which replaced First Input Delay (FID) in the Core Web Vitals list fairly recently, calculates a score based on all interactions users take on a page.
Common culprits for poor INP performance include heavy JavaScript, data fetching on click events rather than pre-populating common actions like navigation bars, or not relying on caches for repeated actions.
Optimize for responsiveness to improve real-user INP scores.
Hopefully, this helps you understand the underlying causes of problems within each CWV metric. There’s much more complexity to how these scores are generated — particularly with CrUX data — which we’ll cover next.

CrUX Dashboards: Monitoring Real-User Site Performance Data
The Chrome User Experience (CrUX) report is Google’s main source of real-user performance data. It aggregates anonymized metrics from actual Chrome visitors to your site. The Core Web Vitals are gathered from this data and then passed to Google to use within its ranking systems.
You can view your scores in Google Search Console or generate your own dashboard with Google’s CrUX Dashboard template. You can also dig more into the CruX data to better understand the numbers here.
These reports are powerful tools for trending your website’s performance. If an issue impacts a large section of popular pages on your site, you’ll see a rise in negative scores — and vice versa for improvements.
The CrUX reports’ main weakness is that they don’t show exactly which pages contribute to the scores or how many pages were sampled. More investigation will be needed before taking action at the page level.
How to Use CrUX Data Reports
- Sitewide health monitoring: Trend your site’s CWV over time to quickly spot major changes.
- Device comparison: Break down results by desktop and mobile to see where problems lie.
These high-level views help you catch broad changes in your site’s performance quickly.
A secondary use case for CrUX data is tracking site performance across different devices. Device comparisons can give strong clues about where performance issues are — for example, if your mobile performance scores lag far behind desktop, it can give you a big clue as to where the problems are.
For page-by-page analysis, extract data from the CrUX API or run a Lighthouse report on individual URLs. (But keep in mind that Lighthouse runs from your local machine and tests a single page at a time.)
Getting Page Performance Data at Scale
(Warning: self-promotion alert!)
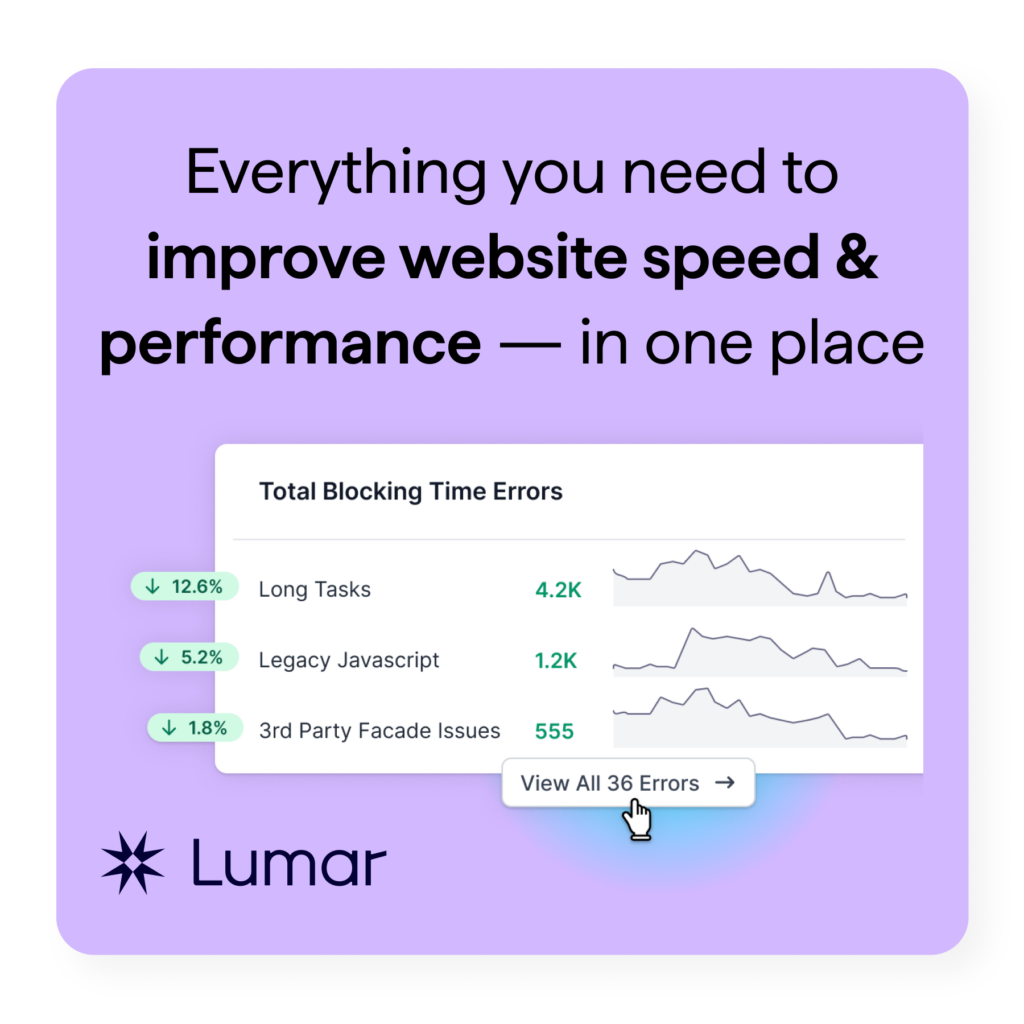
If you want to do a page-by-page performance analysis at scale, then you can use Lumar’s site speed metrics as we do have Lighthouse crawls and the ability to pull in real user metrics (RUM) from the CrUX API.
A final note on CrUX dashboards: because of how Google provides this data, much of it is effectively public. This means you can look up a competitor’s CWV trends over the past year — but they can also do the same to you. (Useful to know if you are trying to figure out where your site stands in the competitive landscape!)

Lighthouse: Turning Data into Action
Let’s finish off this exploration of site performance, Core Web Vitals, & SEO with a deep dive into Lighthouse — an open-source tool built into Chrome for generating performance metrics and actionable recommendations. It’s totally free to use and generates pretty detailed reports about what exact items on the page are causing problems as well as providing suggestions on how you can fix them and the potential benefit.
Lighthouse is a great starting point for any performance audit. Its only real downside is that using it in Chrome means you can only really test one page at a time. (More on that later.)
How to Run Lighthouse in Chrome:
- Open the page you want to test in Chrome.
- Open Developer Tools (F12 on Windows, Option + ⌘ + J on Mac).
- Click the “Lighthouse” tab (if you don’t see this immediately, you may need to click the >> icon and select it from the drop-down).
- Choose your settings and click the big blue button to start analyzing.
- Clicking this button will generate a report for the current page — make sure you leave the window open while it runs to avoid skewing results. (Shifting focus whilst this is calculating can mess up the report.)
Once the report is complete, you’ll see four scores out of 100 — these scores indicate where there are problems detected on your page, with detailed breakdowns, screenshots of individual items, and even snippets of the code that is triggering the effects.
Prioritizing site performance issues with Lighthouse data:
Typically, the way I use Lighthouse is to gather multiple pages’ worth of details and group similar issues together. The purpose here is to prioritize issue fixes and tackle the problems that are impacting multiple pages first.
This is helpful for prioritizing bigger site impacts and provides a better justification for getting this work done when you are pitching fixing these issues to developers.
Generally speaking, I would prioritize anything that impacts page loading first. Load time delays tend to have the biggest effect on users and can quickly compound if there are multiple things delaying the page from actually loading.
Hopefully, this was a useful introduction to site speed and performance — and a helpful reminder that user experience matters for SEO, too.
By focusing on Core Web Vitals, CrUX data, and Lighthouse diagnostics, you’ll build a faster, more user-friendly, and more crawlable site — all important aspects of technical SEO.


