Where has the time gone? It feels like only a few weeks since our last update, but here we nearly half way through the year! And a lot has happened in those months, so let’s dig into some of the key changes.
Platform: Accessibility Metrics
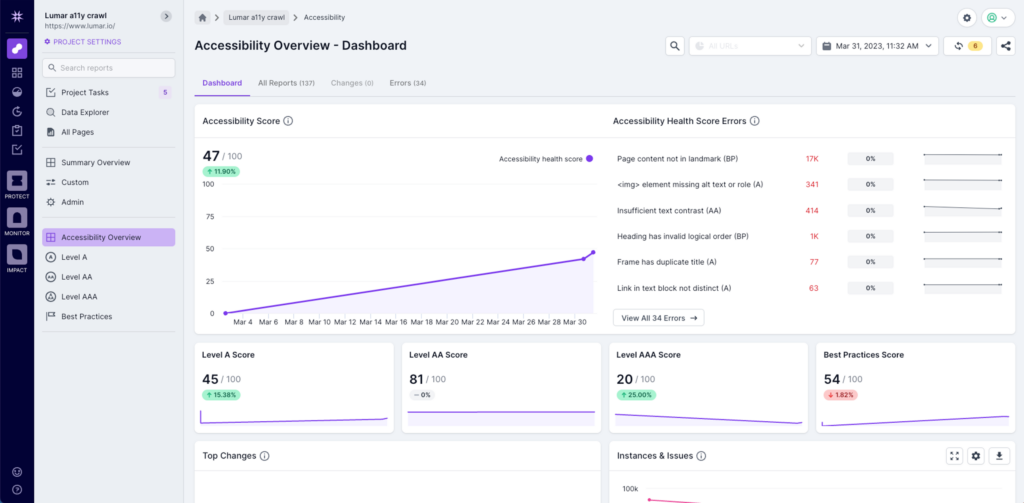
We’re thrilled to have recently launched new accessibility metrics in the Lumar platform, so you can use the same platform for identifying, prioritizing and fixing both technical SEO and accessibility issues.
The metrics are aligned to WCAG 2.1 and cover Levels A through to AAA, and additional best practice recommendations. Users can prioritize issues more effectively with our accessibility health scores, and also save time by reducing the number of false positives for issues like color contrast, thanks to Lumar’s bespoke technology.
Accessibility metrics are available in Analyze for audits and detailed analysis, Monitor to get a high level view of accessibility issues across multiple domains or one large site, and in Protect to for automated accessibility QA testing.
Find out more about our new accessibility metrics.

Platform: Deprecated and Changed Reports
From time to time, it’s necessary to deprecate or change some of the reports in Lumar that are no longer relevant, or have been replaced with an alternative. We’ve therefore implemented a new process to advise you of these changes. When you search for a particular report in Analyze, you’ll see that the title is suffixed with ‘DEPRECATED’ to show that it is in a deprecated state. The report will continue to be generated for 3 months at which point it will be removed permanently.
We’ve also created a new deprecated and changed reports article on the Knowledge Base to show which reports are going into a deprecated state or changed, the reason why, and the date that it was either changed or will be removed from the platform.
Deprecated reports will show when searched for, but will not appear in the ‘All Reports’ list. The deprecated reports will also be shown in Monitor and Protect, so you can switch them out for another report as required.
Platform: New Sidebar
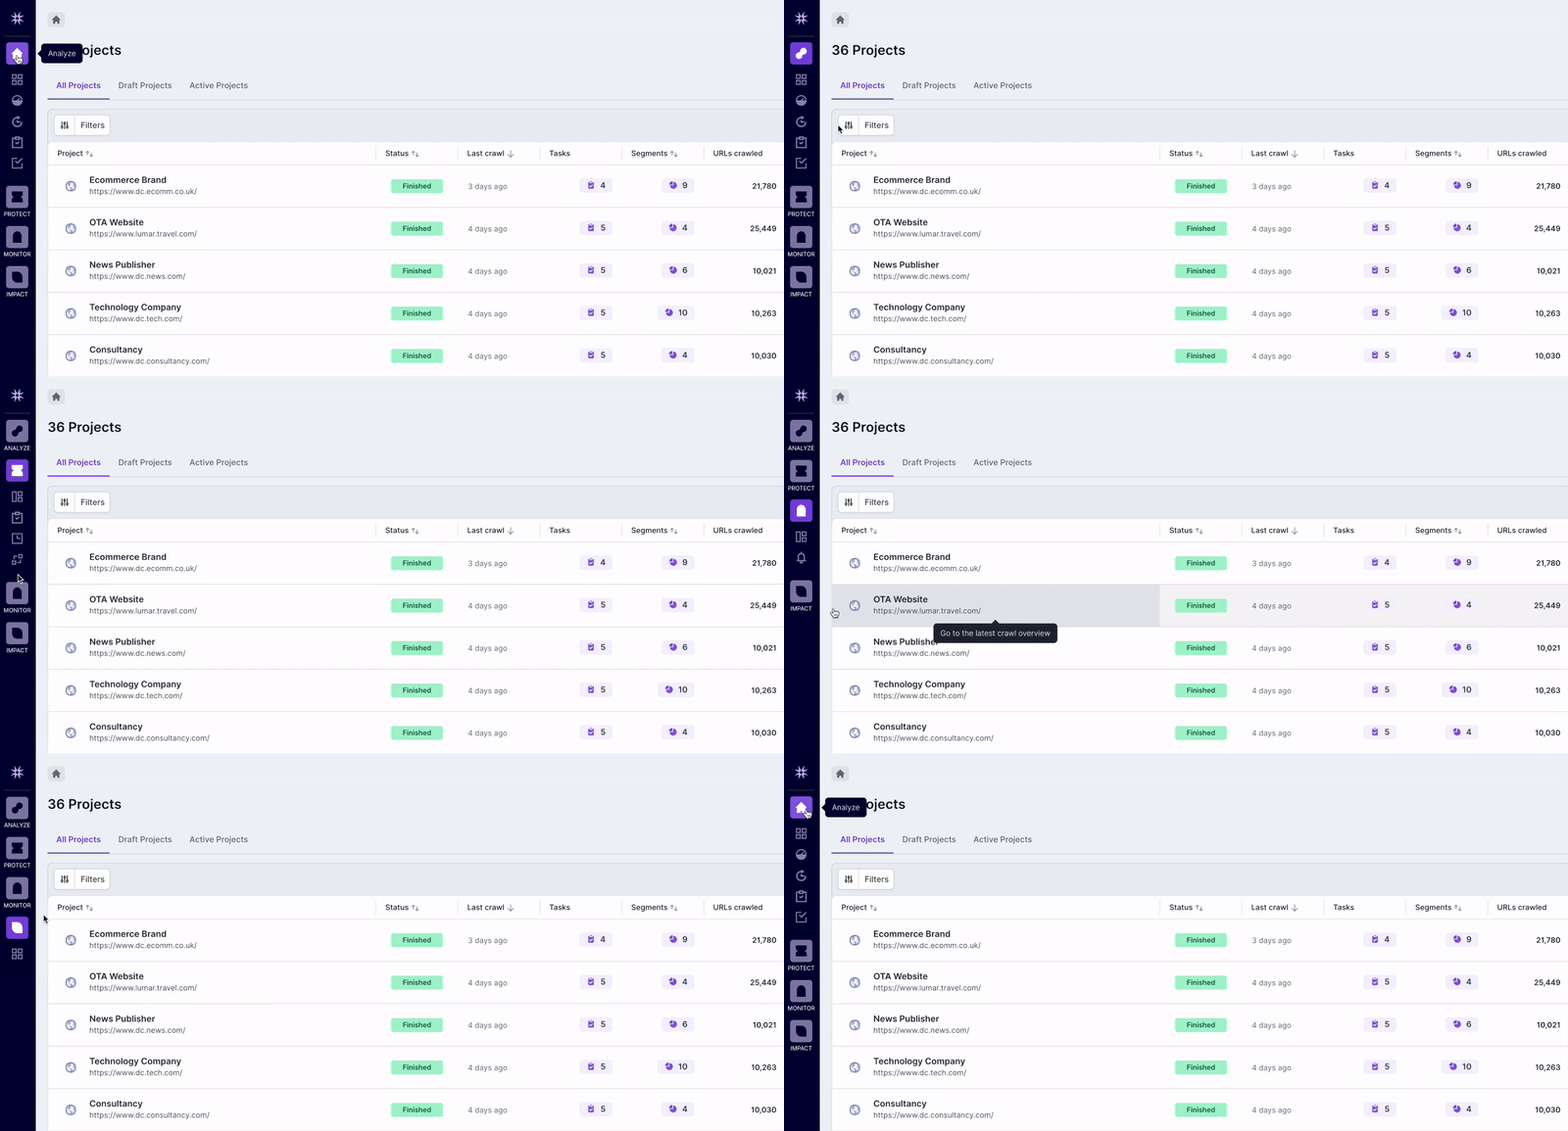
To make switching between Lumar apps easier, we’ve changed the left sidebar so you can see all apps in one place. When you click a particular app, the icons related to areas of that app will open up so you can quickly navigate to where you need.

Analyze: Account Tasks
In the icon list for Analyze you’ll also now see an icon for account tasks. With this view, you can see all of your tasks across all projects in one place, helping keep on top of how tasks are progressing, and what needs to be done next.

Analyze: Client Cookies Setting
We’ve added the ability to send cookies to be present in the browser while rendering, which can be used to impact the page before any metrics are calculated. For example, to accurately measure accessibility metrics you may need to hide certain pop-ups such as cookie acceptance banners. You can find the cookies setting in Advanced Settings, in Step 4 of the crawl setup.
Read more about the new Cookie Setting and how to set this up.
Monitor: Segmentation
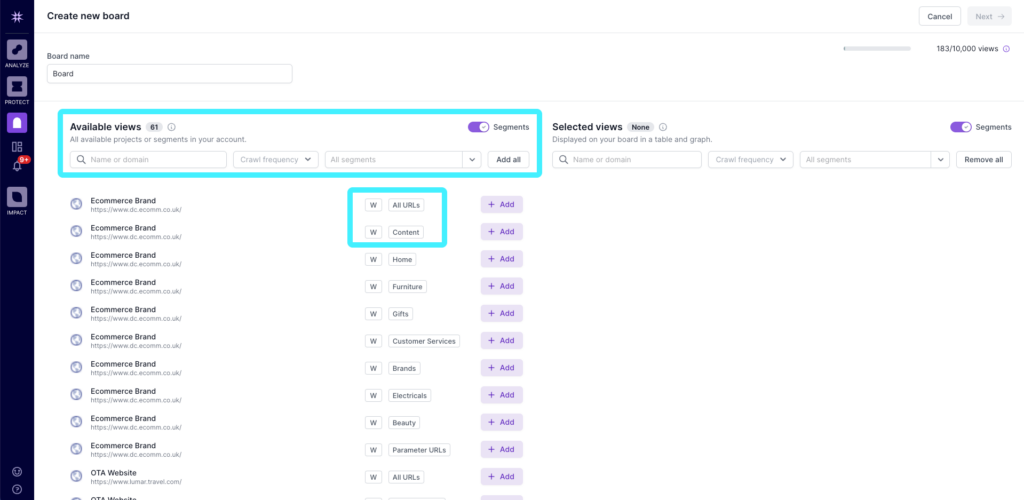
To allow more granular monitoring of important site sections, we’re also supporting Segmentation in Monitor. This will allow you to focus on monitoring the most important part of your site and domains, and improve the efficiency of your workflows.
When creating a new board you can enable segments in the available views and you’ll see ALL URLs or the name of the segment that’s available. You can also filter the list in the top section.
Find out more about creating dashboards in Monitor.

Coming Soon…
New Page Details View
We’ll soon be releasing an improved version of the page details view, which will re-introduce the ‘all metrics’ and ‘changed metrics’ views and provide some additional information on where the pages were found, and included resources.
GA4 Connector
With standard Universal Analytics properties no longer processing data from July 1 this year, our team is working on an updated Google Analytics connector. We’re aiming to have this released at the beginning of June. We will also be supporting GA3 for at least another year, for those customers using GA360.
New Page Views Metric
We’ll be introducing a new metric of Page Views so you can see not just how many visits a page gets, but also the number of views. This gives a new way to assess valuable pages in your site.
Retrying Failed Sitemaps
Previously, when a sitemap failed, the crawl would progress without retrying. Soon, the crawler will be able to retry a sitemap to see if a response can be received to ensure as full as crawl as possible.
Robots.txt for Resources
We’ve identified an issue with robots.txt for resources where, in some cases, this wasn’t respected while rendering. We’re therefore working to fix this issue to ensure it is always respected, matching Google behavior. Our new crawler now provides the ability for this to be an option in the settings, so you’ll be able to choose whether to respect robots.txt for resources or not. As there may be some changes to crawl results by the change in behavior, all new projects will have it enabled. You can then choose whether to enable it for previous projects as required.
Improved Redirect Chain Metric
We’re making an improvement to the redirect chain metric, so it will be clearer which type of redirect (HTTP/JS/Meta) is used in each step of a redirect chain.
Alerts for Segments in Monitor
Earlier this year we added the ability to use segmentation in Monitor. We’re now working on being able to apply Monitor’s alerts to these segments, for added granularity in notifications.
Feedback
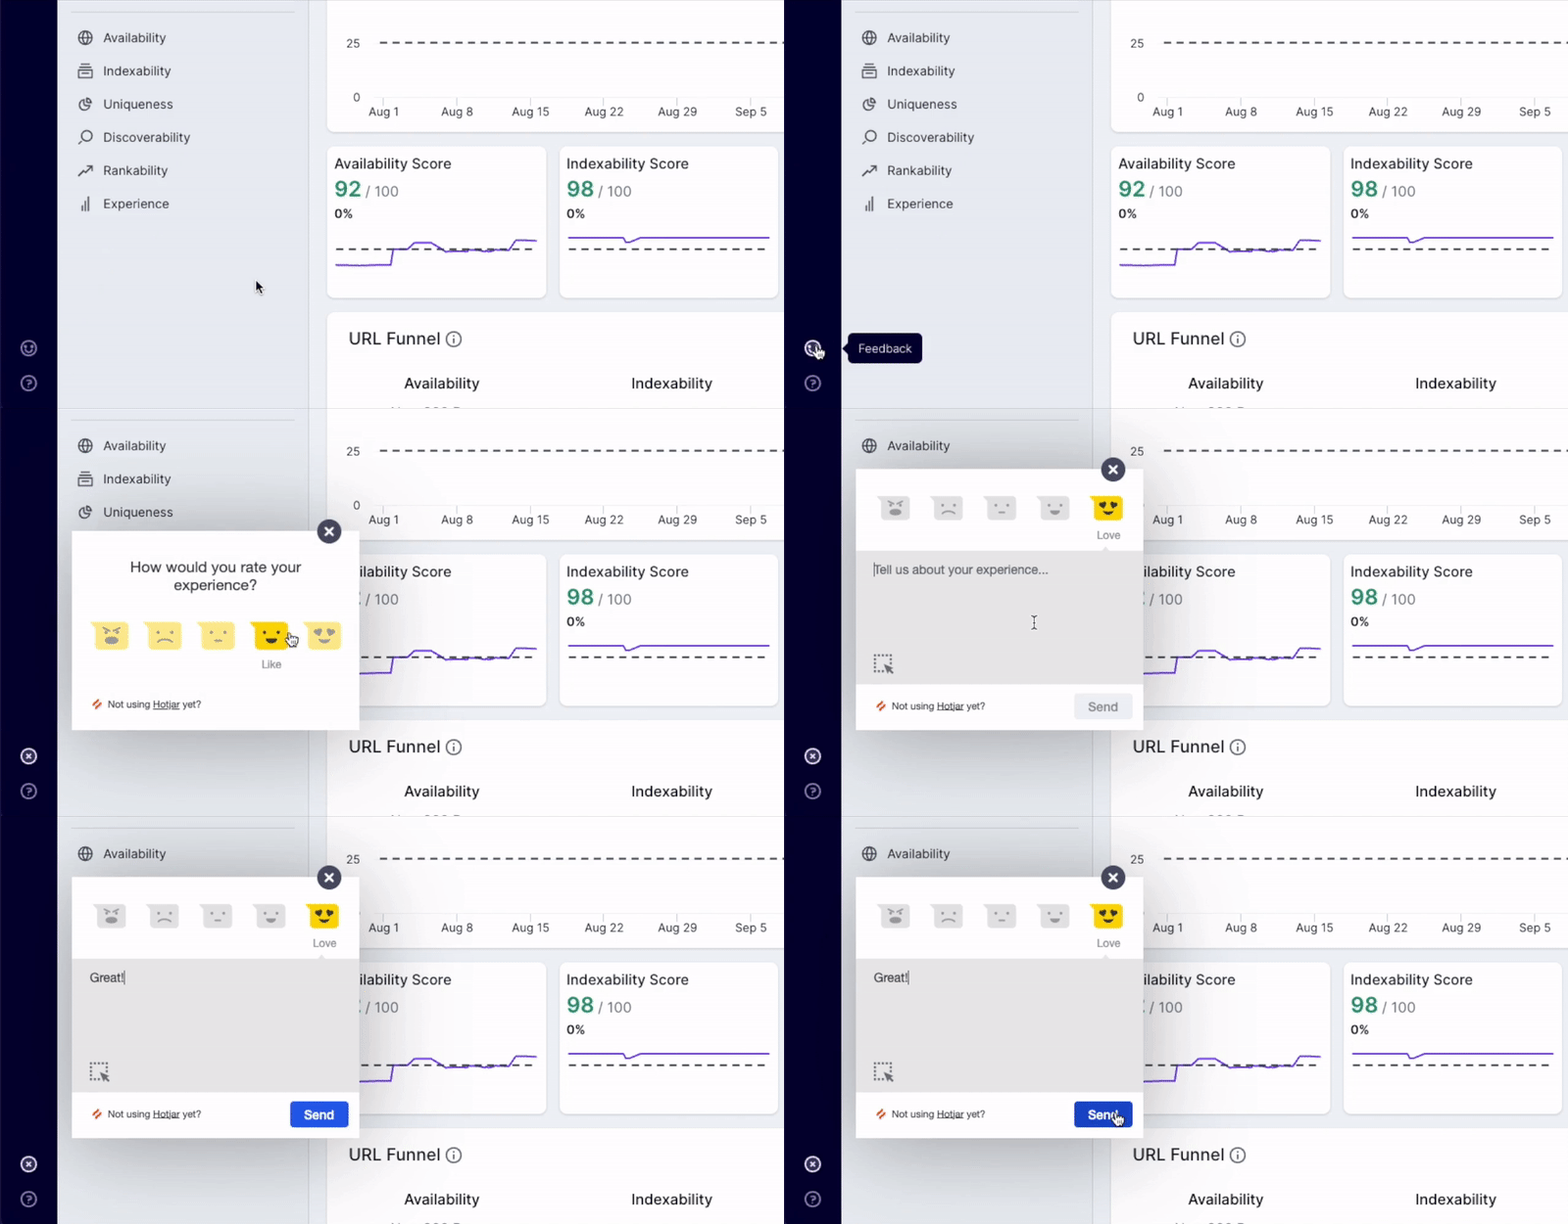
As always, we’re keen to hear your feedback to help us improve the Lumar platform. You can do this very easily by clicking on the smiley face in the bottom left-hand corner of any of our apps.
