

Over the years I’ve done a lot of Google Analytics Audits, written the measurement plans, and worked with teams to set up accounts that provided clean, usable data. It is a job I’ve loved doing, and I still get a kick out of training and showing people how to get the most out of the tool.
I’ve always learned something new with each audit I’ve done, but I also found in doing so many, that there were common themes and mistakes that cropped up again and again, and these issues trashed the data, or made the data in the account unusable when it came to gleaning any insights based on it.
I put this down to a mix of ‘you don’t know what you don’t know’, that there isn’t really any formal training to understand and setup GA, and the information out there concerning what to do and in what order is not always clear.
So, that is where this post comes in. I’ve focused it predominantly on Ecommerce sites, but the advice here can be used across the board and applied to any business that uses Google Analytics.
There are some common themes that I’ve found over the last few years. They aren’t in order of precedence, more that they follow a logical order: fix one element and the next one makes more sense.
Here’s a summary of issues we’ll cover:
- Getting the Correct Account Structure
- How To Avoid Data Discrepancies
- Right Idea, Wrong Filter, Wrong Order
- Enable Views to Receive Ecommerce Data
- Not Getting Site Search Data
- Not Finding Out More About Your Audience
- Turn on User Metrics
- Not Using Content Grouping
- Not Using the User ID Feature
- Having no Event Tracking: OR they have bad Event Tracking
Now, the big question here, why should you care?
Well you, your boss, or your clients are looking at Google Analytics and making decisions about where to invest money, what strategy to push, which tactics are working, who gets a raise, and who gets the sack.
If the data inside that GA report is a little grubby, inaccurate, or lying to you, then you are making bad choices before you have even finished your morning coffee.
Have a clean setup means that the reports will be a lot easier to digest (and use) in demonstrating how amazing your search marketing work is doing for the sites you manage.
Having the wrong ‘House Set up’: Getting the Correct Account Structure
What is it?
You need to understand how your Google Analytics account is structured, as it has implications for data collection in the first instance, then configuration and processing, not to mention the reporting that you base your decisions on.
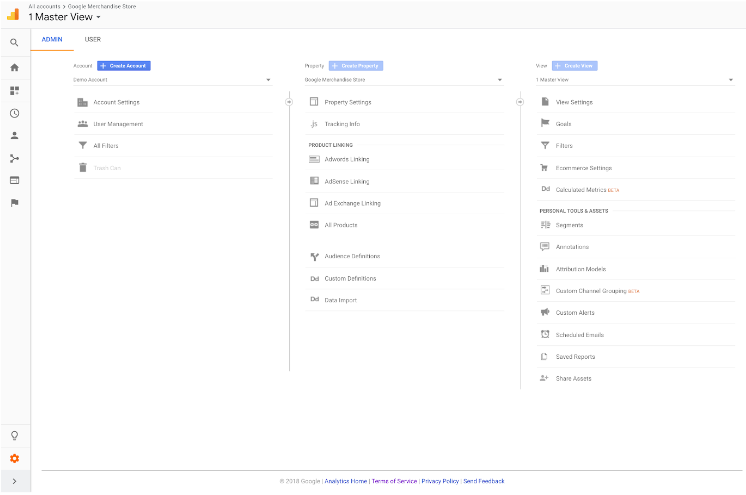
It fried my mind when I was learning about Analytics and account structures. If you look at your Admin settings, you will see something that looks like this. It is split into 3 sections. Account, Property and View.
To help, I came up with a model, aptly named ‘The House Model’©.
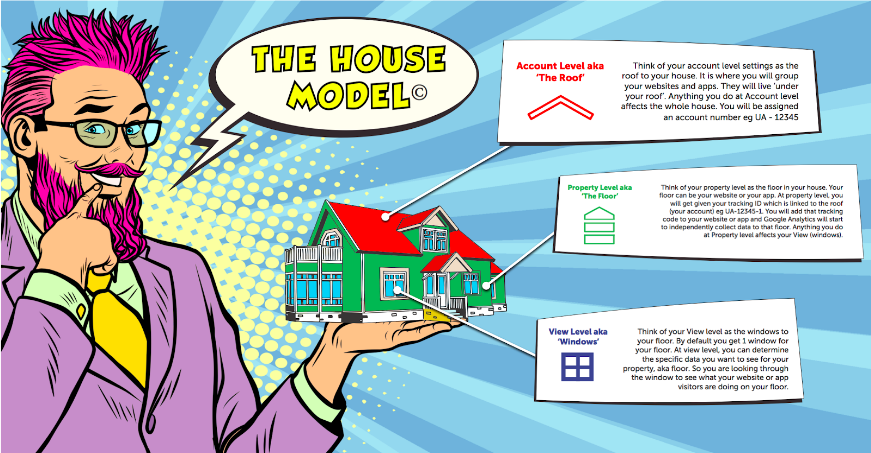
If you think of your Account level settings as the roof to your house, this is where you will group your website and apps. They will all ‘live under one roof’ and anything you do to your settings at the Account level will impact the whole house. In Google Analytics, you’ll be assigned an account number e.g. UA-12345.
Your Property is like a floor in your house. Your floor can be your website or your app. At Property level, you will get your tracking ID which is linked to the roof (your account) e.g. UA 12345-1. Anything you do at the Property level will impact your Views further down the chain.
When we come to View level, think of this as windows to your floor. By default you will get one window for each floor. At View level, you can determine the specific data you want to see for your property. So you are looking through the window to see what people are doing on your floor. The View is the lens that you will be looking through when you are looking at the reports in Google Analytics.
Common Mistakes: Having the Wrong House Set Up
Over the last 150 or so audits that I’ve done, this comes up a lot more than I thought it would, especially with ecommerce sites.
Imagine this, you have a site, but it is a mix of domains and subdomains, typical example:
- Blog.website.comThis domain had lots of content around the product and lifestyle, brand messages, and used to be found for top of the funnel questions and answers at a pain aware stage of the customer journey.
- Website.comThis domain has all your products on, information about the company, and how to get in touch with you, FAQs that sort of thing.
- Shop.website.com When a user wants to buy the product, they are sent to this domain which has all the information about the products and allows users to select sizes, colours, watch videos of someone wearing the products, add to basket etc.
- Account.website.comIdeally when the user hits the buy button they can create an account (or continue as a guest), but on this domain, the user can login, see their order, make more purchases, load reviews about the product etc etc.
So what goes wrong? Let’s revisit the House Model.
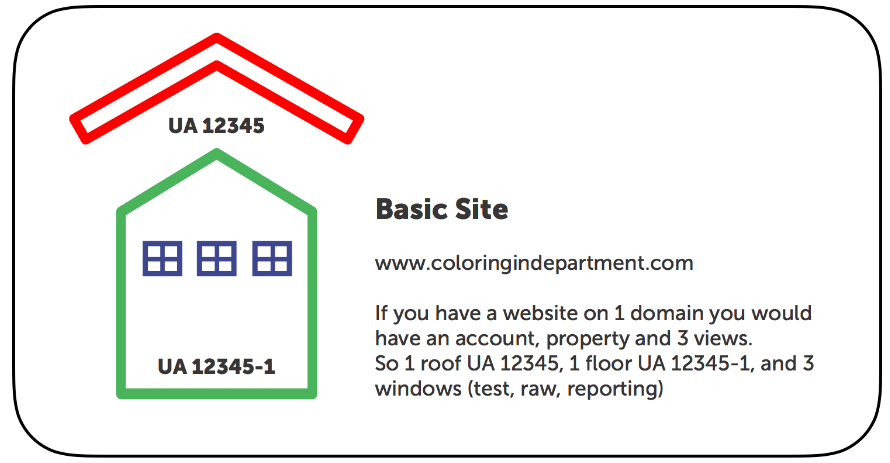
A basic site would look like this. Now if you have ALL of your business objectives on one domain, you have a setup that would have 1 roof, 1 floor and then your various windows.
Multiple Domains
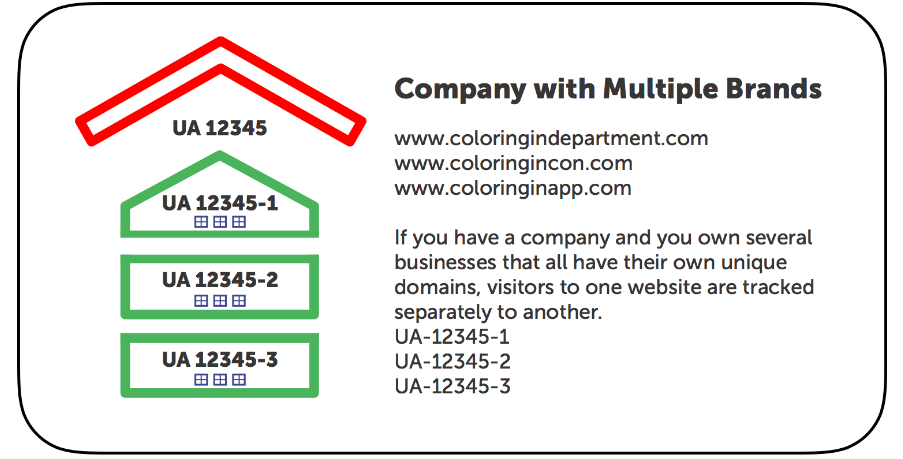
When we have an ecosystem like our ecommerce example, I see people build a GA account structure that looks more like a townhouse or a skyscraper. Which is wrong.
Why is this a problem?
Well if you have all your domains and subdomains on separate floors, you won’t see the full customer journey, which is obviously going to mess up your data. And by mess, I mean unusable – you may as well throw it into a dumpster and set fire to it.
I may sound a little over dramatic, but let’s walk through a customer journey that you want to track, but you have set up your account like a skyscraper, when it should be more of a long bungalow.
Let’s say someone arrives on the blog found organically, and they click on the CTA on a lovely blog post to see the product, which takes them to website.com. As you can’t see through floors, you can’t see through Google Properties. This means your analytics is going to record a user and their session and assign a Client ID to the visitor who is reading your blog, and when they go to the website.com they are treated as a new user to a new property, you will then lose the data in terms of the Source/Medium, your analytics will show that your referring source was Referral and the Source the URL of the blog.
Bad news then for the SEO team who are now not going to get any credit.
Move further into the customer journey and you’ll want to build goals across properties, but you can’t because, again, you can’t go through the data floors.
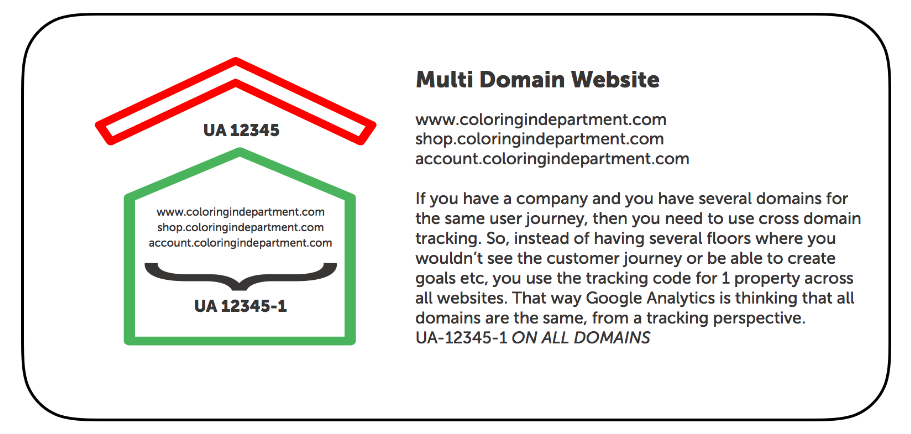
What to do to fix it? Cross Domain Tracking
When you want to see the whole customer journey and build goals across the domains and subdomains, you need to set up your house like this, using something called Cross Domain Tracking. You will use one property ID across ALL the domains you want to track. Here is a useful page from Google on setting up Cross Domain Tracking.
Now let’s move on the the next chunk of mistakes and issues that have tricky data implications.
Bad Admin Setup, How To Avoid Data Discrepancies.
Not having 3 views
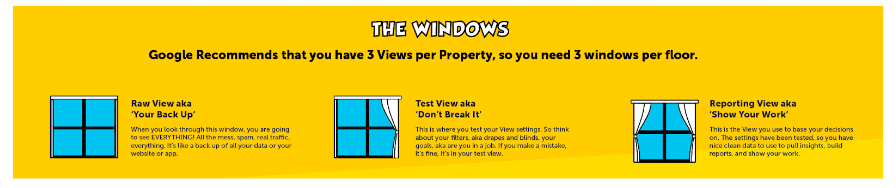
Google recommend that you have three Views per Property (or for our House Model, 3 windows per floor).
- The Raw View is like a back up.
- The Test View is where you practice your view setup, check filters and goals etc and check it all works.
- The Reporting View is where you roll over all your tested work and use to report on your super marketing.
The windows work by adding filters, which is a bit like adding drapes and blinds to your windows.
The thing that can really make your Views shine is filters, which I like to refer to as Drapes and Blinds. You can determine what you see when you look through the your windows by applying filters to the View.
However, Google Analytics will process your data as per your Account, Property and View settings. This is where I see mistakes that cost you dearly, as the data can not be re-processed. It is like trying to add a curtain outside your window, it may look nice, but it isn’t going to work.
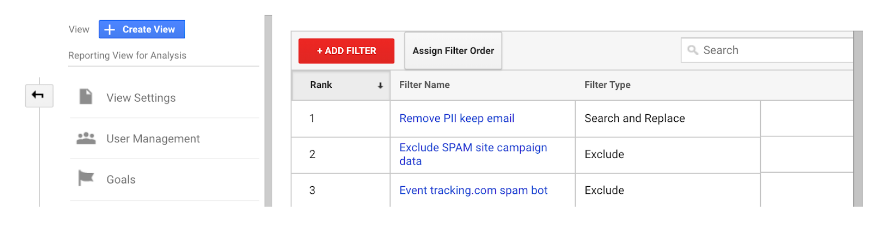
Common Mistakes: Right Idea, Wrong Filter, Wrong Order
Errors when creating Views to see traffic from different countries.
I see a lot of ecommerce sites that create Views to see different data sets, for example to show people from a country. Most of the time, they had the right idea, just the wrong type of filter.
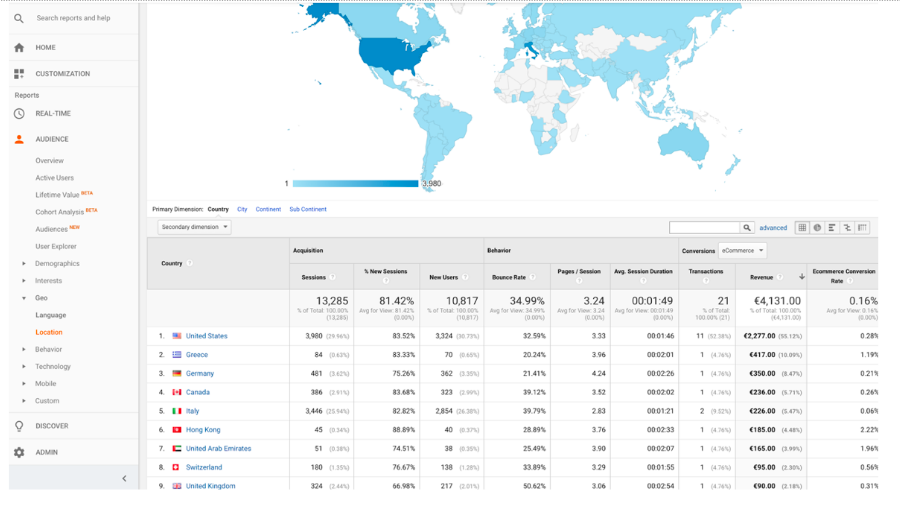
Example 1: I reviewed a site where they created a View called Europe and the data looked like this. As you can see, the data shows people from all over the world when we looked in the Audience report. Clearly with a whole load of traffic showing up from the United States this View is not pulling in the right information.
How to fix
The filter they used was a custom filter asking Google to only include visitors who go to pages that contained /fr for French traffic or /es for Spanish etc. The problem with that filter is that you could access the different locations on the same navigation no matter where you where in the world, so it didn’t work, and if it was done in a test view it would have been picked up.
Instead they should have added a filter to say only INCLUDE traffic from the Country that matches {enter the country/city/etc as per GA}. It is case sensitive to Google’s data so if you wanted a view for the states you have to write United States as that is how it appears in GA , if you wrote USA the filter would not work.
Errors in Revenue at View level
Another audit that I conducted started with the Marketing team getting a tough time from higher management that the GA data did not match with their CRM or Salesforce data in terms of revenue made from the website.
I’ve seen this problem more than once, and my go-to place is typically the View set up and Filters.
In addition to checking any other issues with Filters, having a look for staging and or dev sites that are used to test the site out, checking payments, making sure the engine all works is all needed. In some audits I’ve done, the development team had their own view with a filter to only include traffic from the staging or dev site.
How to fix
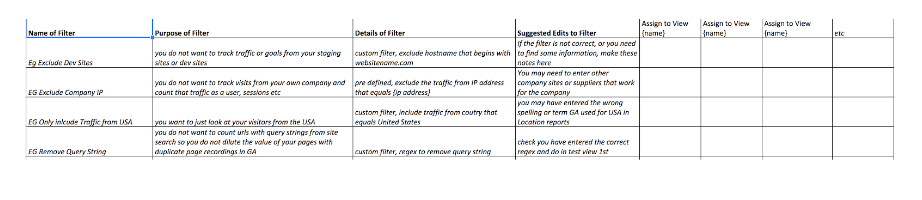
Have some formal documentation. Not just for the sake of a Google Sheet but to keep a record for all to see and behold. Because when you do lay out your filters and see where you want to assign them, you can see patterns of filters you need to include and exclude across the board.
So in my common case scenario, if you have a View with a filter to only include staging or Dev then you need to add an Exclude filter with the same pattern on your reporting views. You want to document the purpose of the filter, how you will create it (the details) and which Views you are going to assign or counter the filter.
You can find a Google Analytics Admin Audit Template here to help you audit your Admin Settings and map out your filters.
Tip: Right Filters, Wrong Order
The next mistake is having the right filters, but in the wrong order, just remember that one filter’s output is the next filter’s input.
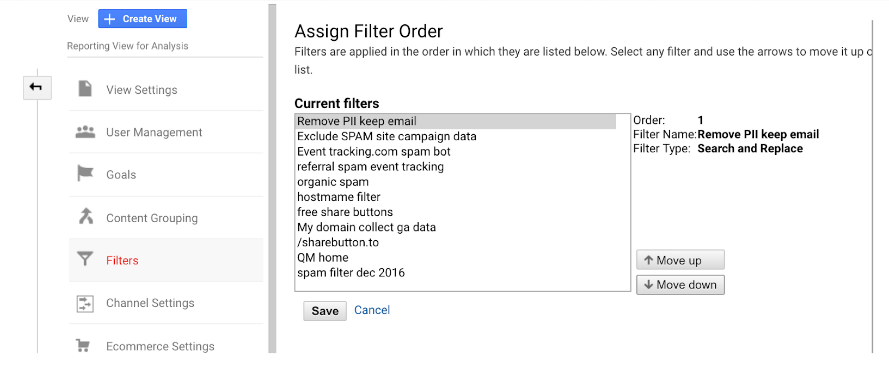
You need to head over to your View settings and select filters, you then want to select ‘Assign Filter Order’.
Here you can just move them up or down so you get the filters in the order that you need then to work in, again do this in Test View and when you are happy with the data, roll on over to your Reporting Views, just remember to check the filter order again (always check again 🙂 ).
Enable Views to Receive Ecommerce Data
There’s nothing more painful for me than to do an audit and have to tell a team that they have not had months or sometimes years of Ecommerce data inside their GA account, because someone didn’t know to turn on the toggle for Google Analytics to receive that data. I really hate waste.
In plain simple English, IF your dev or web team have set up Ecommerce Tracking YOU still have to turn the toggle on to each View you want to see the Ecommerce data on.
You can find help from Google here which explains how to set up Ecommerce Tracking.
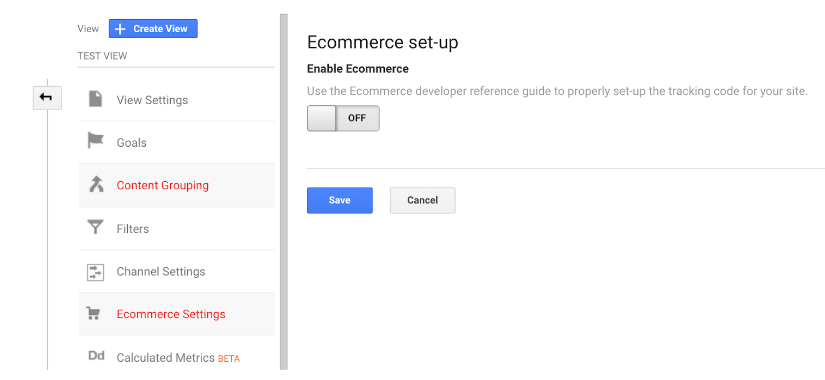
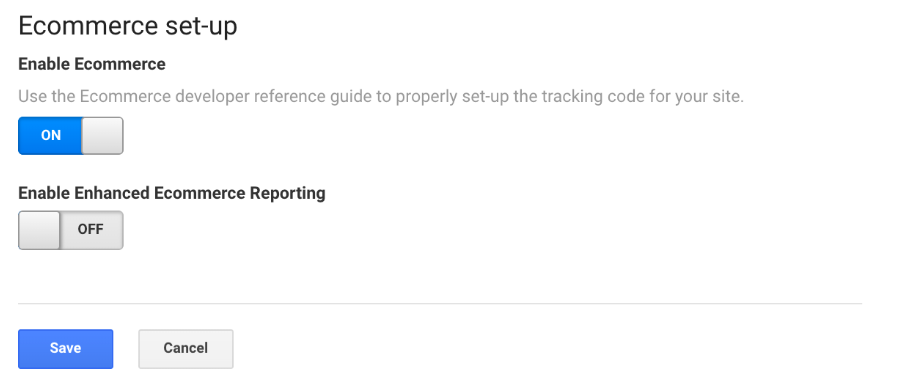
How to fix it
Head over to your View settings, select Ecommerce Settings, and have a look if it is turned ON, and if you have Enhanced Ecommerce (which gives you more juicy reports) that also needs to be turned ON. Basically, developers can code up your pages to have Ecommerce Tracking, but unless you turn these toggles on, you do not get the data into the account. Once again to reiterate the point, you cannot go back in time and retroactively process that data.
You should refer to Google’s Support Pages on how to correctly add the special tracking code to your transaction completion pages.
Google Analytics now supports multiple currencies and if needed these can be converted
into a single base currency. If you do this you should use a separate profile for it. However
converting into a single base currency is a double-edged sword from an analysis point of
view, because it takes the exchange rate (from Google Billing) at the time of the conversion.
That means a drop in revenue could be either due to performance issues or possibly a shift in
the currency markets as this excellent post from Brian Clifton explains.
You really want to make sure you have this enabled, as you want to show the impact your search marketing is having on the bottom line, without it, you are guessing.
Not Getting Site Search Data
Oh, I love a bit of site search data; that little bar you all have on your sites where your customers are typing things into. You really want that data. It really can be a little gold mine as it tells you what people are looking for. If you don’t have that information, write about it, if you thought it was obvious to people where to find it but they are getting stuck, improve the user experience to help people get what they need faster, or if they are looking for something you don’t have or write about, you can get some ideas for content. I also use it to check on how people misspell words and bid on them over on my PPC campaigns.
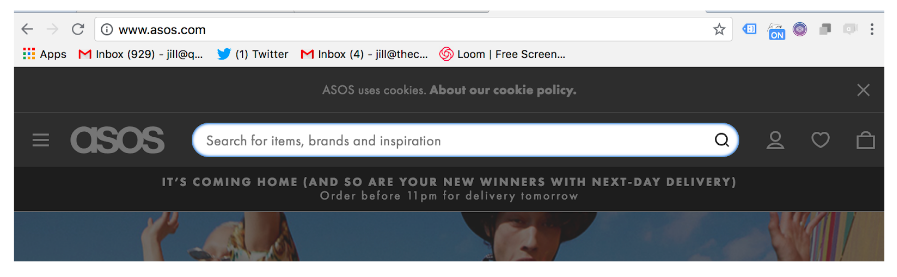
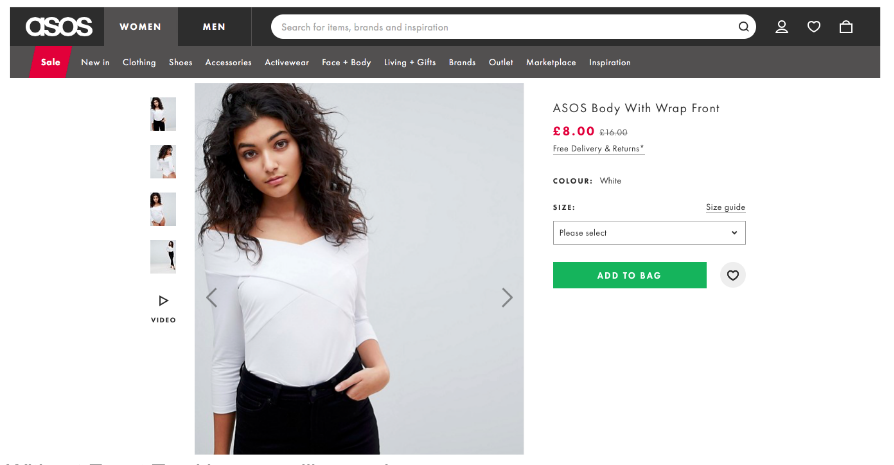
Let’s look at Asos as an example, if I type ‘football tops’ into the search bar it will show me the results and also you get to see the search query URL
https://www.asos.com/search/?q=football+tops
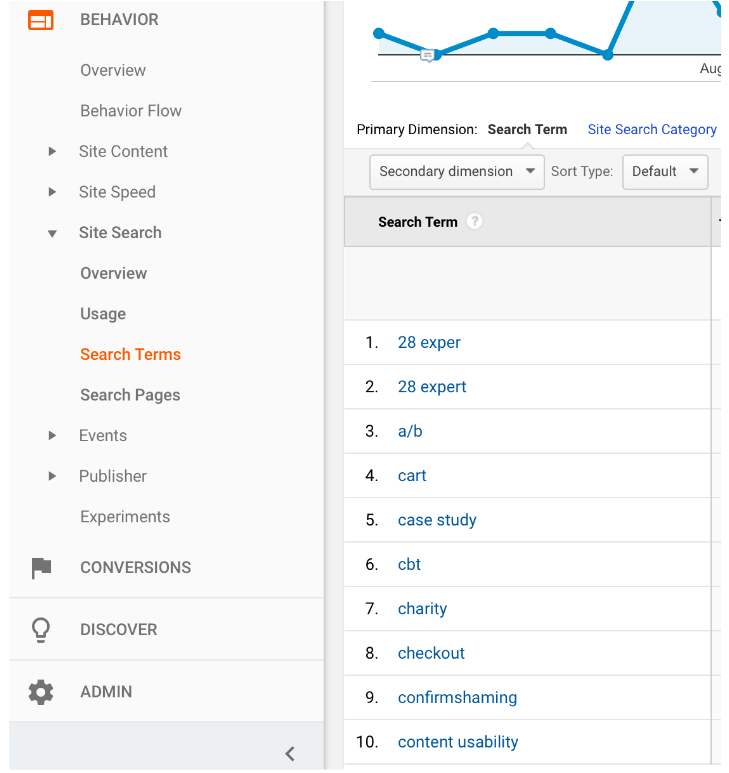
If you want this data, you need to head over to your View Settings and turn the toggle ON and let Google Analytics know what the query parameter is, common ones are s or q, in our Asos example the query parameter is q.
Then when you look in your Behaviour > Site Search Report you will get something like this.
Not finding out more about your Audience
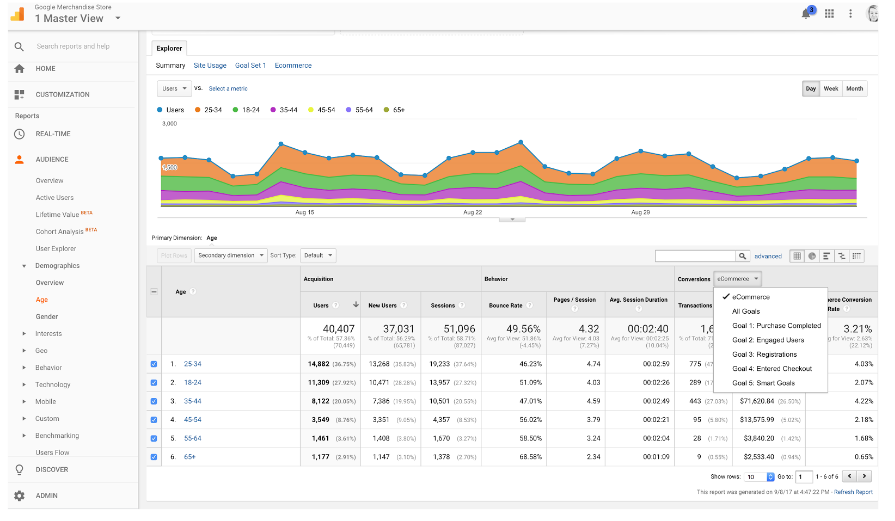
If you go over to the reports and select Audience > Overview, at a high level it will tell you how many users you have, how many pages the average user’s session will be, and how long they stay on your site. Super stuff.
What I really like about this report, when you have enabled this feature, is that you can drill down to see how old your readers are and if they are men or women. It always surprises me how these cohorts behave and there is the option (in all the reports) to see how well the age and genders do in regards to your conversions. If you found out that most of your readers were in a certain age range and gender, would you change your tone and style of writing?
Tip: create a segment in the report to only show users/sessions where the Medium is Organic and you will get a better idea of who is finding you on search, and who is spending money.
How to fix
If you want to get a little more, you can head to Demographics > Age or Demographics > Gender to see how old they are, and if they are male or female.
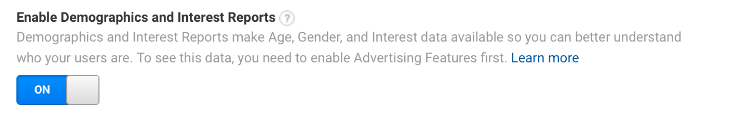
However, if you want to get this data you have to enable this feature in your Admin settings. Head over to Admin > Property Settings and turn the toggle on
Turn on User Metrics
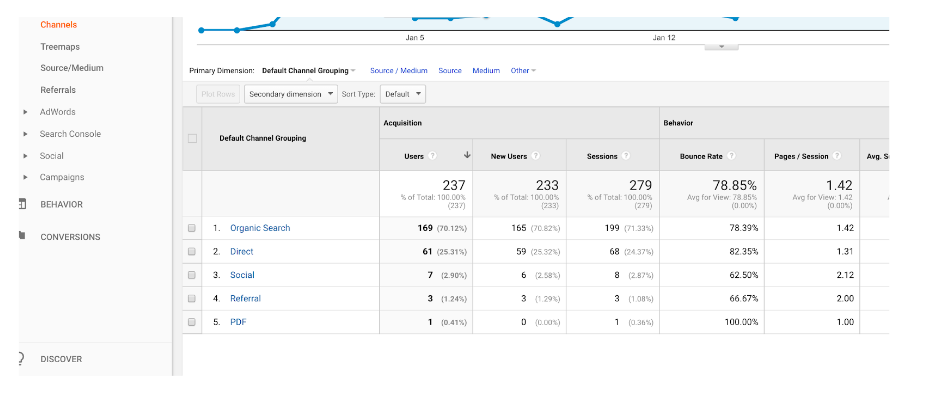
This example below is an Acquisition > Channels reports. If you look we have Session, % New Sessions, New Users etc.
When you have turned the toggle on, in your Property settings to Enable User Metrics in Reporting, the same report will include Users in addition to the other metrics and dimensions.
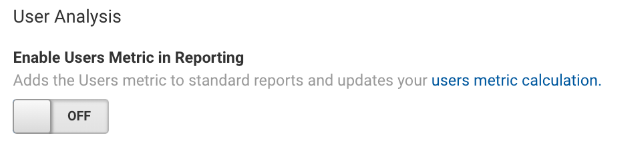
The Users and Active Users metrics show how many users engaged with your site or app. In early 2017, Google Analytics began updating the calculation for the Users and Active Users metrics to more efficiently count users with high accuracy and low error rate (typically less than 2%). The metrics are available across your standard reports, however, you need to turn the toggle on to see the data within your reports
This is important as you want to show data for Users and Sessions, if you look at just sessions, you are missing a piece of your insights jigsaw. I’ve taught enough people now who thought that Sessions were Users, so it would help to just have that data side by side.
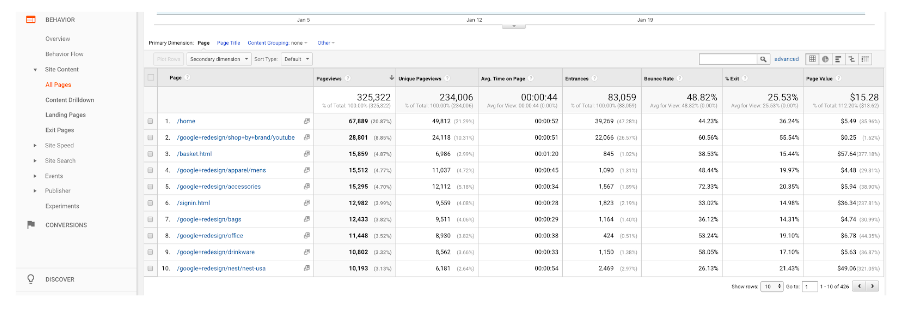
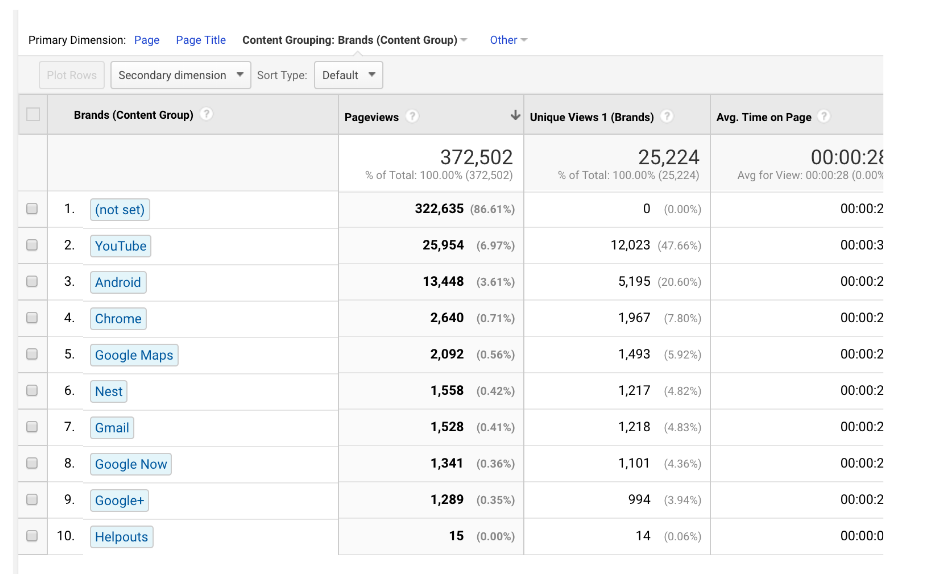
Not Using Content Grouping
If you head over to your Reporting interface and see Behaviour > All Pages you will see all your website pages, which is ace, BUT it can get very, very busy (I want to cry kind of busy), and with that, hard to see just what people are looking at on your site.
Which is where Content Groupings come in.
If you are focused on Search and you want to see the pages that people are looking at and where the bulk are going, e.g. product pages, blog pages, etc., that gets quite hard to see when you have hundreds, or thousands, or tens of thousands of URLS.
The good news is you can create something called a content grouping. I like to think of this as a nice filing system to group pages together, a bit like a filing cabinet. You just need to understand how your website information architecture is structured.
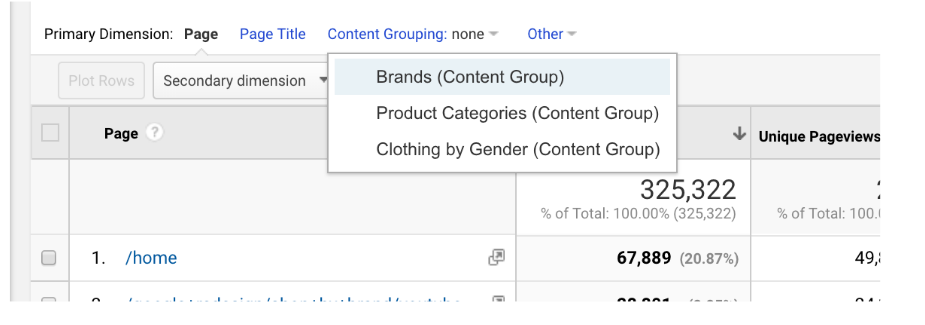
The Google Demo Account for the Merchandise store has a use case where they have created content groupings for Brand, Product and Clothing by Gender. It can be a real time saver to see where your traffic is spending its time on your site.
And, GA gives you five content groupings per view. Whoop!
How to fix
To create them you click Create a Rule Set. Give the ‘folder’ a name and then tell Google what the rules are e.g. page begins with, starts with etc, and then write the name of the URI structure.
Hit done, and make sure you scroll to the bottom and hit save. You can check out a Google Support page on Content Groupings here.
When you have completed your Content Grouping at View Level, when you go back to your Behaviour > All Pages report, if you hover over Content Grouping (it will say none even if you have created them), you need to click on the drop down and any of your five content groupings that you have created with be shown here. They will start to work the DAY you create them, not retroactively.
Not Using the User ID Feature
When you can have User ID and you aren’t using the feature, it’s a bit of a sin in my Google Analytics book. Ecommerce sites in particular can use it, as the majority I’ve worked with and audited had a part of the site where a customer can create an account and log in, so that they can add products to favourites, see their delivery status and leave reviews.
If you have the ability on your site to allow a user to login, then you get to play with this. It means if a user is logged in on a smartphone, laptop, desktop or tablet, they aren’t seen as separate users or sessions, but they are reunited as one, and you get to see how your users work across devices.
Here’s an example of an Ecommerce site in their Reporting View (the window they are using to show their work). If you take a look at the Audience Reports and see User Behaviour, you can see all the Client IDs. With that, I’m not necessarily able to really work out who these people are, or if they were on different devices.
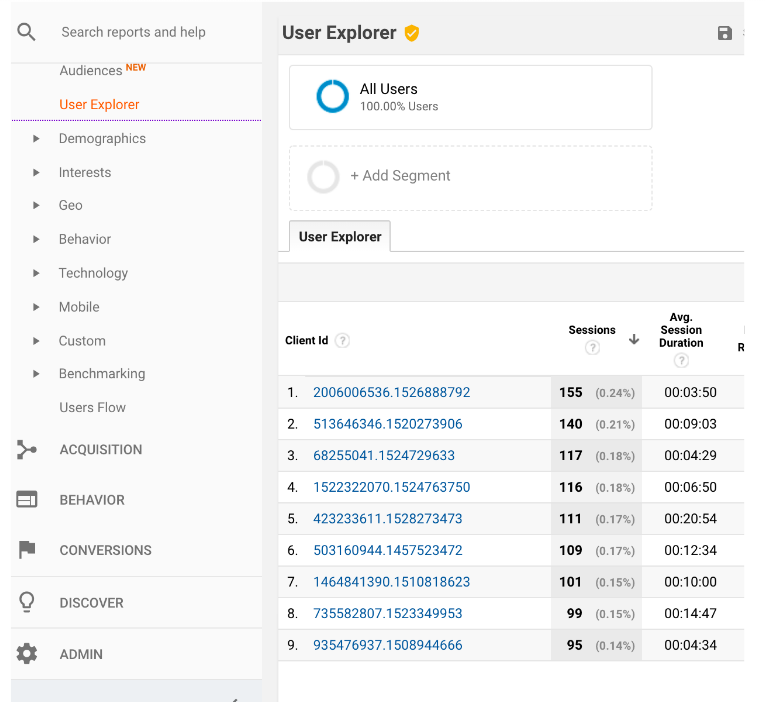
If you enable this feature, Google Analytics will swap out the person’s Client ID with the ID you give them when they create an account which is then linked to your Data management system, which may be a CRM.
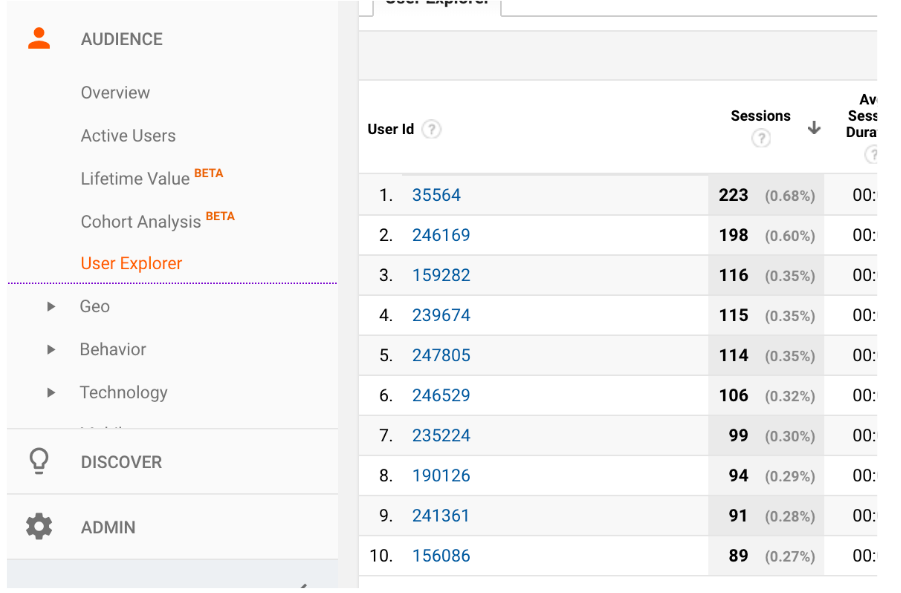
You have a new View that you need to create called User ID and this shows all the IDs for customers (no personal identifiable information in here though guys, unless you want to get sued) but here is the extra report for Cross Device.
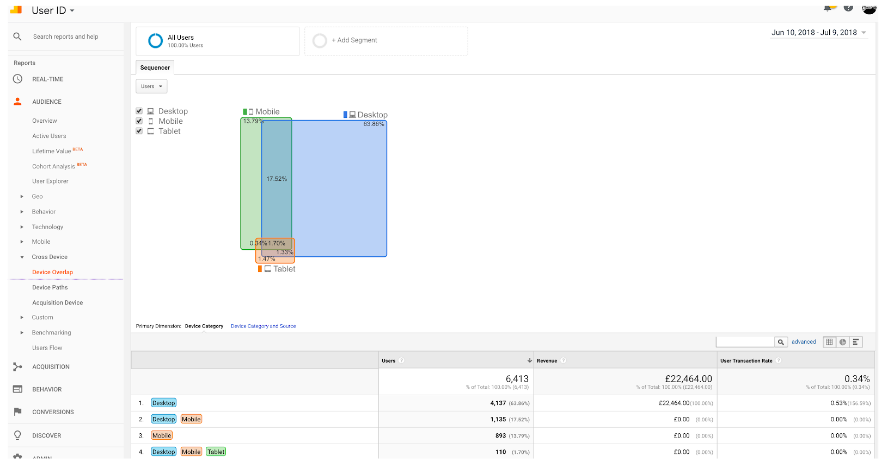
Now imagine, being an SEO and being able to use a User ID view and see how people are working across mobile and desktop. Build segments to see the device, and Medium = Organic to start digging around in the landing pages and Behaviour report effectively. It’s pretty sweet. And I don’t need to remind anyone about how important mobile is right now.
Having no Event Tracking: OR they have bad Event Tracking
Event tracking can be used for a whole lot of things. Events will essentially fire when something happens on a page that isn’t automatically tracked by Google Analytics. It can be used to send extra information about your website interactions which enable you to better understand what your users are doing on your website, so you can find out if they are engaging with your website and doing what you want them to do.
Without Event Tracking you will never know:
- Who scrolls down the page?
- Who opens the tabs to expand text?
- Who clicks through to social media accounts?
- Who prints the page?
- Who shared content on social media?
- Who clicks the phone number?
- Who clicked the email address?
- Who submitted the form?
- Who clicked the images?
- Who played the video?
- Who downloaded the PDF?
- Who got halfway through the form and gave up?
- Who added to basket?
- Who favorited an item?
- Who selected sizes/colours?
The process works on a neat Category, Action and Label structure.
Categories are big buckets for you organise your events into broad groups.
Example: Videos
Actions describe the ‘doing’ i.e what is the action that we are tracking.
Example: Played video, downloaded PDF, clicked telephone number
Label is used to further describe what you are tracking e.g. the name of the video that your users are watching, the name of the downloaded PDF etc.
Example: Company Welcome Video, Company Brochure
Value is extra information that you can use to assign a value.
Tip; Be careful how you name your Events, so that when they show up in your reports you can quickly and easily understand the data that’s there.
How to fix
Audit your website to identify what you want to track . Start with your Home page, then move on to your ‘money pages’ i.e. forms, product pages, content pages, landing pages for campaigns. Arrange these in logical categories, actions and labels.
You will need to use Google Tag Manager to set up Event tracking. However, it is our job to correctly define, and label, our events to brief developers or agencies in correctly building them.
If you have Event Tracking in place it is worth doing a review and check if you have missed any events or if the existing setup is correct.
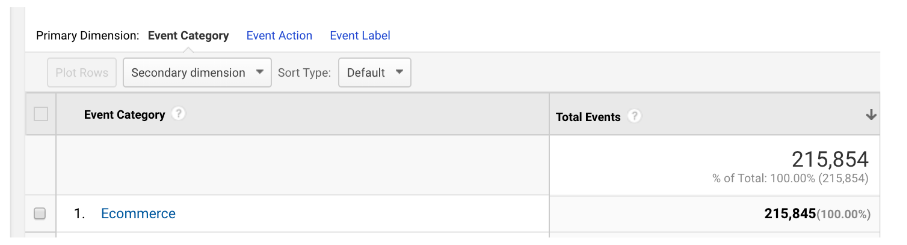
I’ve seen examples like this one below a few times this year. This was for a retailer who assumed they were tracking things like, video plays, adding to basket, selecting sizes, calling customer services etc. It wasn’t. Nor will it be the last time I see this in Behaviour > Event Reports.
Category = Ecommerce
I thought, OK I like to see more than one category but we at least have something.
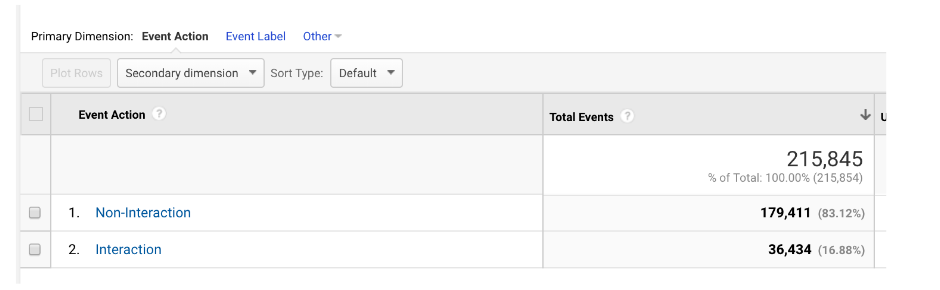
Action = Non- Interaction or Interaction
Hmmmm, ok, lets see what we get when we dig into Interaction.
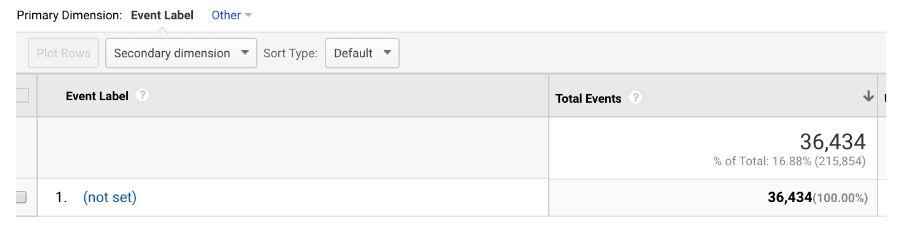
Label= (not set)
For everything – it fired this for the product size selection, the video plays, social media icons clicked. Everything.
Why should you care as a Search Marketer? Well you may need some of this Event data to create Goals, you know those line in the sand conversions you are being benchmarked against?
You also want to use this to see how your users are behaving, from a Search point of view what landing pages people arrive on and what is their intent. Are they on a phone adding to basket, and then back again on the laptop to complete the journey and give you some cash?
Building Goals and Buckets the wrong way
I’ve completed some audits where the client tells me that they have Goals set up, BUT there’s no data, it is not working, so Google Analytics must be wrong, or something to that tune.
Without going into the full on detail of Goal types, if you have a Destination Goal, this is for a URL that you will ONLY arrive at, IF you have completed the purchase or submitted the form.
The mistake I see is down to putting in the correct URL, however, for it to work you need to just put in the URI, which means the bit after your .com or .uk for instance.
How to fix
Have a look at all your Views > Goals and check that they are set up correctly. Tip: make sure, if you change any URLs in site revamps or migrations, that the new URL will need to be updated in your View settings as well.
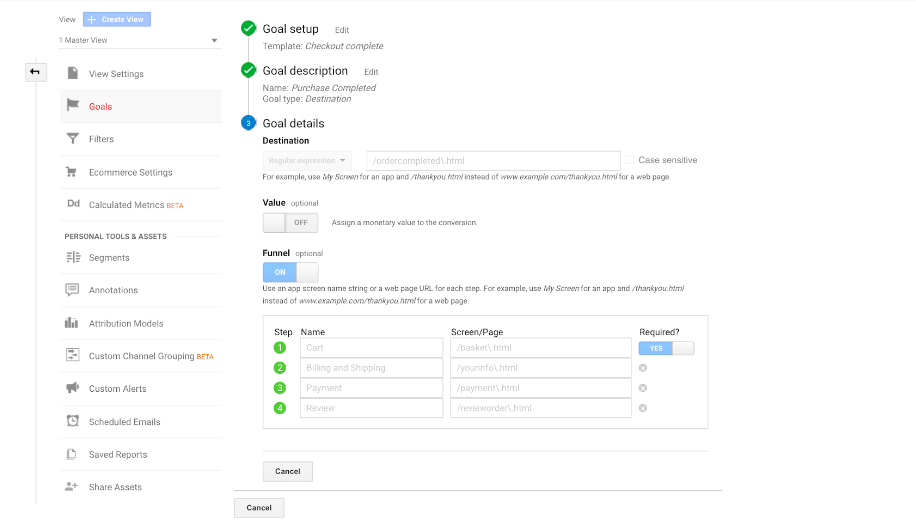
Now, if you have a few pages for people to get through before they hand over their cash, when you build the Goal, you need to turn the toggle for the Funnel option ON, and then Label the steps eg Cart, Billing and Shipping, Payment, etc and add in the screen page or URI.
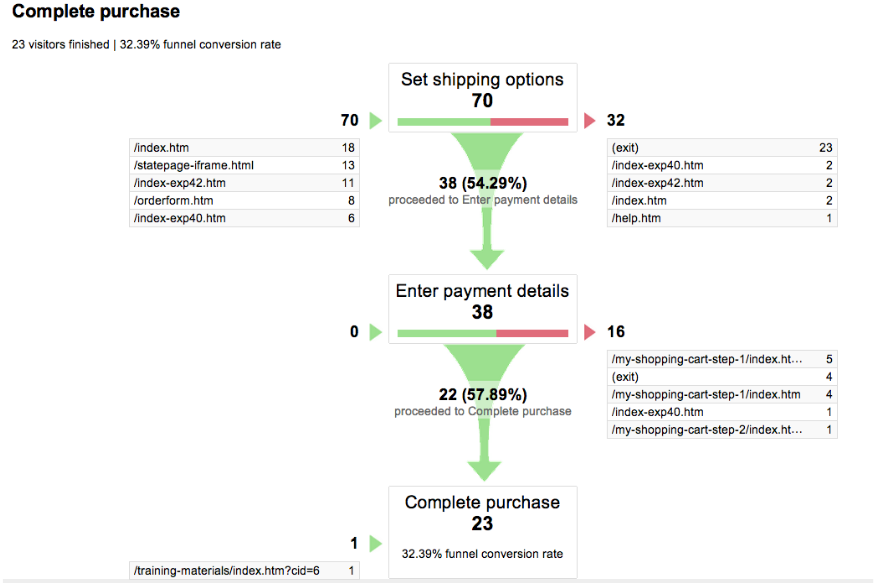
Why do you want to do this? You get a sweet report in your Conversions reports called Funnel Visualisation which gives you an idea about where people are exiting your site and not doing what you want them to do. This should be used to show stakeholders in a nice scary (ish) visual that you have a leaky bucket and you are going to go off and investigate those URLs and see what you can find in the data (layered of course, with some UX insights) to plug the hole and make, more, bank.
And that, my dear friends, is it. The main issues that I’ve seen on repeat for Ecommerce sites.
Here’s your checklist to run through your Admin Audit:
- Get your house in order, do you need cross domain tracking?
- Have you got the correct Views setup?
- The filters for those views, are they correct and in the right order?
- If you have had Ecommerce setup, did you turn the toggle on each View where you want that data?
- Have you set up site search?
- Demographics and interests turned on?
- Add the User Metric to your reports, by turning the toggle on!
- Have you taken advantage of the five content groupings you can have per view?
- Can your users login to your site? Have you thought about using User ID?
- Is your Event tracking correct, in the right order and firing the correct information to your account?
- Have you set up the right Destination Goals and created a funnel?
If you would like an explainer for the House Model you can find that here and the Google Analytics Admin Audit to help review your setup in GA a little faster.