

Site speed is so much more than one score generated by a lab environment test. Arguably, the most important aspect of speed is the user’s perception of performance, which can’t be measured in this manner.
The user’s perception of speed is ever-changing and varies depending on a number of different variables that make up their overall browsing conditions, including:
- The type of device they are using.
- The CPU of their device.
- The type of browser they are using.
- Their internet connection.
You can start to understand just how much browsing conditions vary by looking in the ‘Audience’ tab in Google Analytics. Here you can see which different devices and browsers are being used to view your site with.
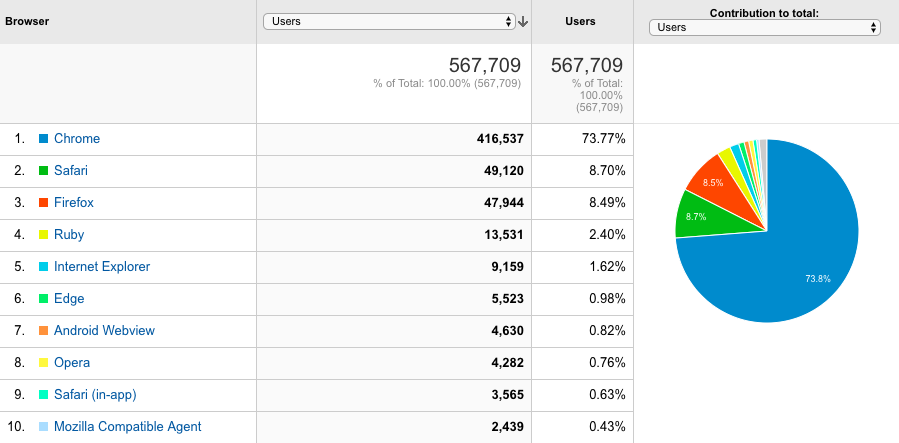
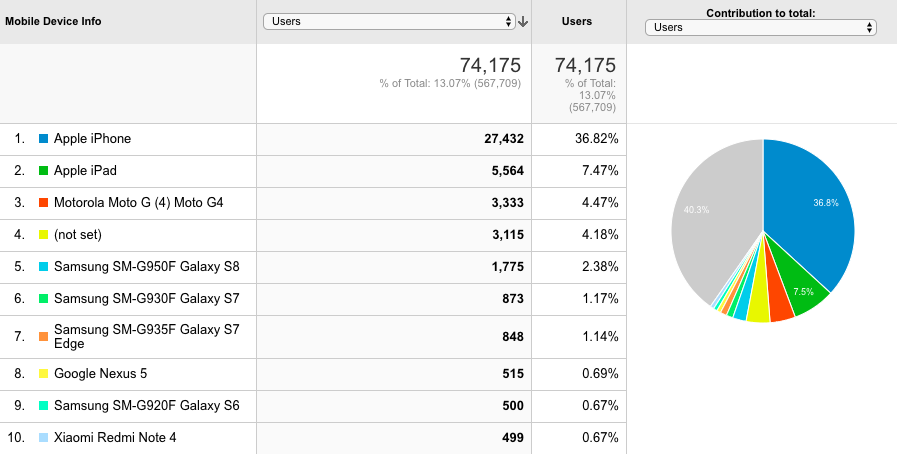
This is why it’s crucial to go down more avenues of testing and analysis to start building a more realistic picture of how users are actually experiencing your website in the real world.
In this guide, you’ll learn more about some of the most effective tools for site speed measurement, as well as the features that make them particularly useful for assessing different browsing environments.
1. PageSpeed Insights
Google’s PageSpeed Insights tool was revamped at the end of 2018, not just in terms of its appearance, but also in terms of the data feeding into it. The tool now uses a combination of lab data from Lighthouse and field data from the Chrome User Experience (CrUX) Report.
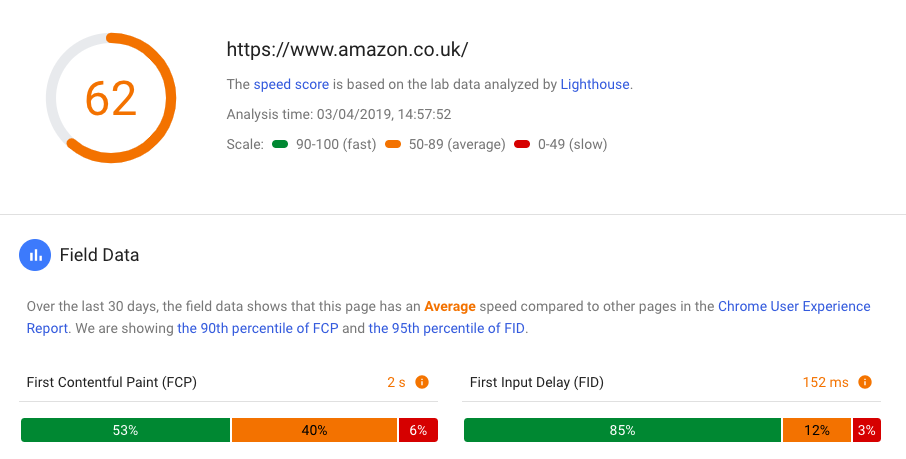
The CrUX data is especially valuable because it shows how quickly sites loaded for a variety of users in the real world.
“The Chrome User Experience Report is powered by real user measurement of key user experience metrics across the public web, aggregated from users who have opted-in to syncing their browsing history, have not set up a Sync passphrase, and have usage statistic reporting enabled.” –Google Developers
The CrUX Report also includes performance data for other websites so you are able to see how your website measures up against others.
2. GTmetrix
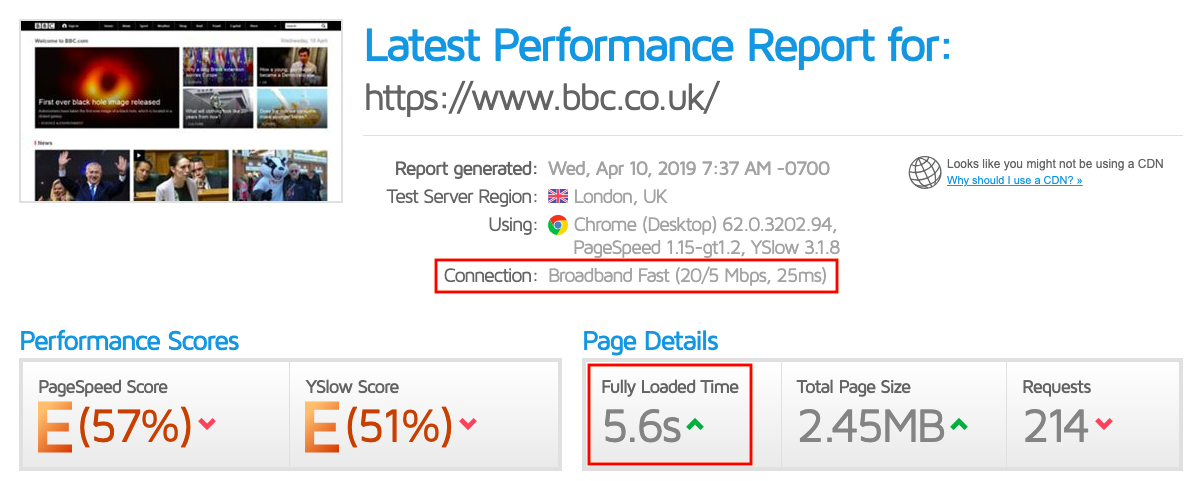
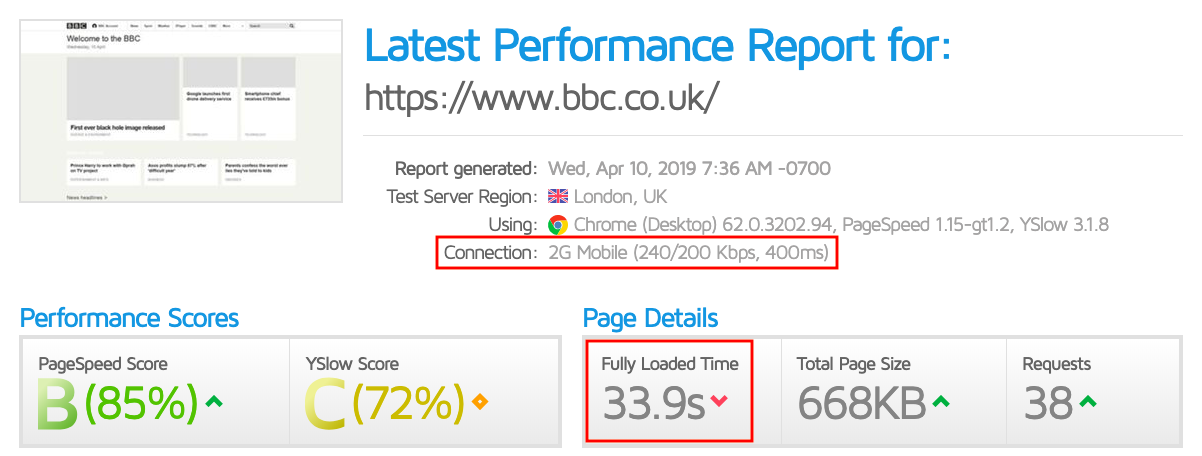
GTmetrix allows you to customise the tests you run by country, browser, device and connection type. This is really useful for mimicking the types of browsing environments of your users and getting an idea of how your website’s performance is impacted by each one.
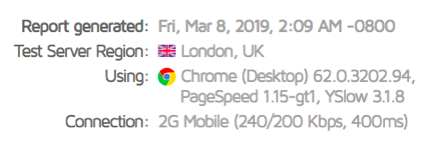
You might be surprised to see just how much performance differs when you change one of these settings. For example, with a fast broadband connection, the BBC homepage loaded in 5.6s. However, with a 2G mobile connection, the same page loaded in 33.9s. This is a significant difference.
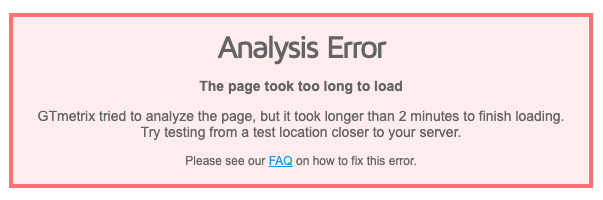
I tried running a test for another website (which will remain nameless) on a 2G mobile connection and encountered the following error message. This is when you know things must be bad!
3. WebPageTest
WebPageTest has a variety of useful features, but one of the most impactful ones is its ‘Visual Comparison’. Here you can input your website alongside your competitors’ sites to compare how quickly they all load against one another.
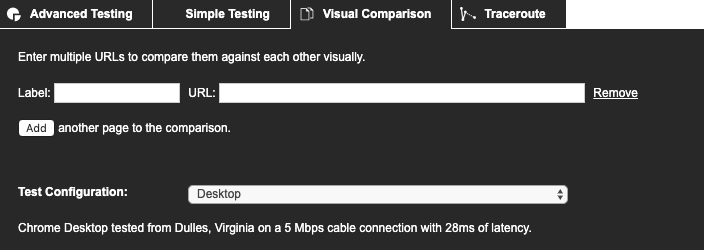
Instead of simply seeing the total load time of each page, you are provided with side-by-side videos of them all loading. This is much more useful to see, as a total load time metric won’t tell you how quickly above-the-fold content was populated, for example.
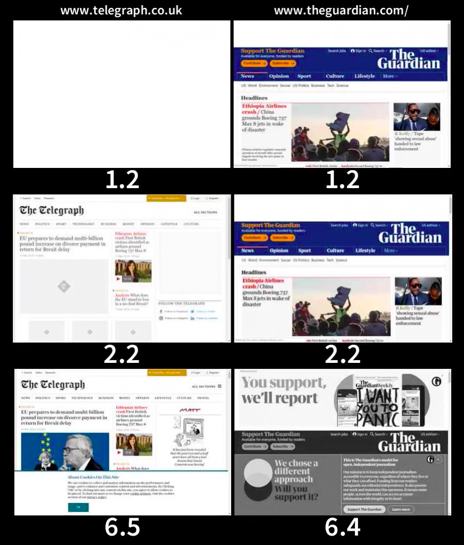
From this Visual Comparison report, you can see that the total load time of The Guardian homepage was 6.4 seconds. However, a user accessing this page in the real world won’t know this. To them, the page loaded in 1.2 seconds, because that is their perception of load speed. The user can’t see what is being processed in the background; they are focused on what is being populated above-the-fold within their viewport.
This is why it’s vitally important to utilise testing tools that visualise what the user will be seeing when a page is loading.
4. Chrome DevTools
Chrome DevTools really is a treasure trove of performance insights. Each tab you click into shows a more interesting report than the last, so I highly recommend testing it out yourself.
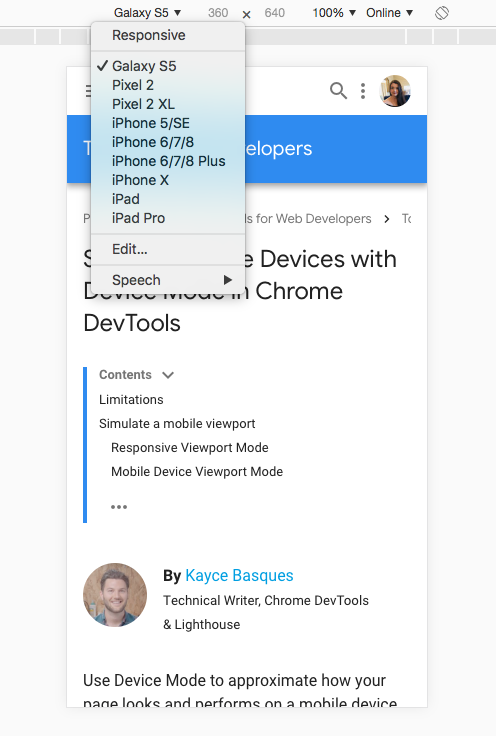
For the purposes of a succinct guide, however, I’m just going to focus on a couple of features that give more of an insight into performance with regard to users. Firstly, you can test rendering and loading performance on different devices.
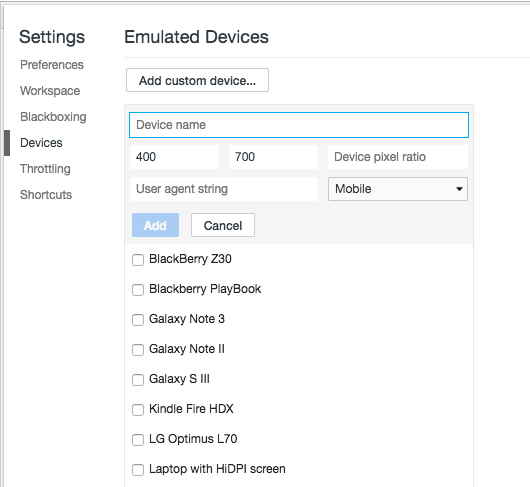
If there is a device you want to test that isn’t in the default list, you can even add your own custom device in the ‘Devices’ settings.
If you want to learn more about which resources have an impact on a user’s experience on your site, there is a useful report under the ‘Coverage’ tab. It shows the amount of JavaScript that was loaded in total on a page vs how much was actually executed, so you can pinpoint unnecessary code that can be removed from the page which can improve load speed.
Tip: Chrome can measure how much unused JavaScript is on your page https://t.co/AYBKnPha0n
DevTools > top-right menu > More tools > Coverage pic.twitter.com/JpslYAuGvf
— Addy Osmani (@addyosmani) January 16, 2019
Loading absolutely everything on a page regardless of whether or not a user will need it isn’t a great performance strategy. It’s important to find areas where code can be trimmed down, and a good way of doing this is by seeing what is actually needed and executed within the user’s onsite journey, and what provides no function or value.
5. Lumar
The other tools mentioned in this article provide performance insights on a page-by-page basis. A crawling tool such as Lumar, on the other hand, allows for a more comprehensive view of your site’s speed as a whole. This allows you to identify and trend issues at scale.
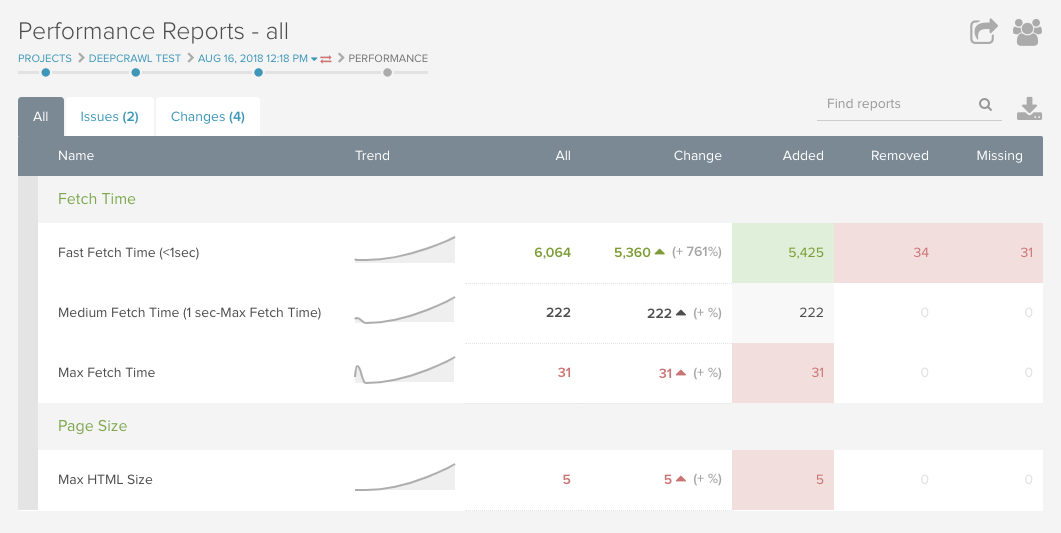
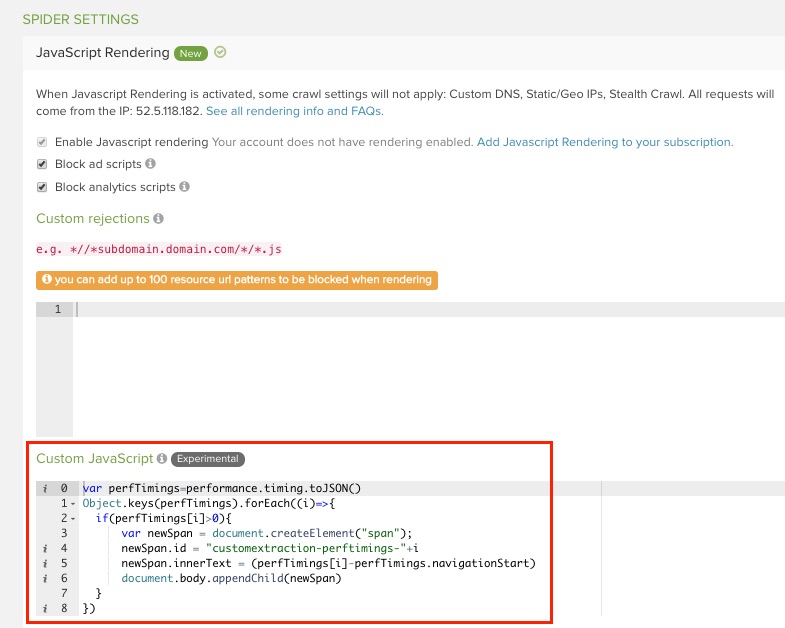
On top of the standard performance reports within the tool such as fetch time and page file size, you can also collect Chrome speed metrics for every one of your pages within your crawls. By using our custom JavaScript feature, you can extract a number of different metrics for each page from Chrome, including First Contentful Paint, DOMContentLoaded, and many more. Being able to gather these insights at scale rather than one page at a time, is incredibly valuable.
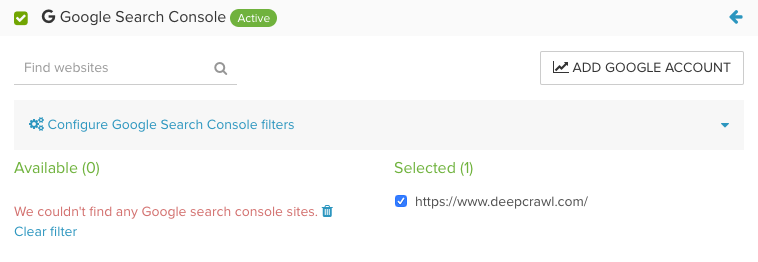
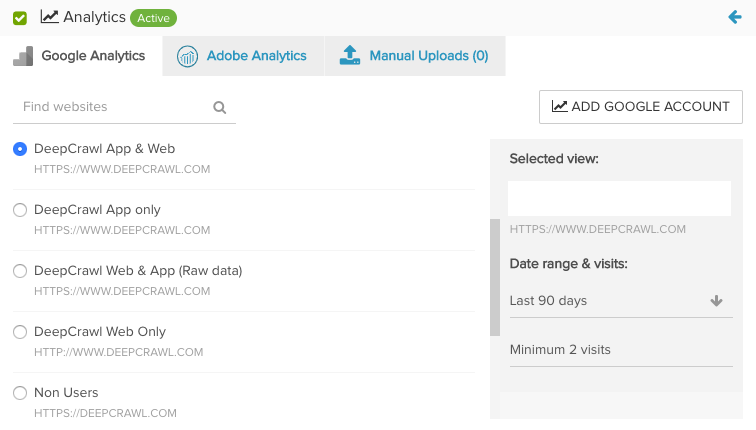
To get the most out of the speed insights within DeepCrawl, make sure you integrate your Google Search Console accounts and analytics accounts to overlay search traffic and consumer traffic data. This way you’ll be able to focus your analysis on the pages that are most often searched for and visited by users and make sure those ones don’t have any significant speed or performance issues.
 There is more that we can all be doing to improve our understanding of the users that are visiting our websites. We hope you found this guide useful and that it’s given you some new ways of thinking about existing speed testing tools, as well as how you approach site speed optimisation in relation to your users’ experiences.
Learn more about site speed & performance with our ultimate guide
 If you’d like to learn about performance in more detail, then make sure you take a look at our ultimate guide on site speed. In this guide, you’ll learn everything you need to know about the different site speed metrics, optimisation tactics that have the biggest impact on performance, as well as insights from industry-leading SEO experts.