

With Google utilizing Core Web Vitals metrics as a ranking factor, SEOs need to be looking to expand their performance testing. Lumar allows you to capture web performance and Core Web Vital metrics at scale in dedicated Site Speed projects and also provides some basic reporting in SEO projects.
What are Core Web Vitals?
Core Web Vitals are a set of web performance and user experience metrics that are based on real-world usage data from Google Chrome. Core Web Vitals metrics are:
- Largest Contentful Paint (LCP). This measures the render time of the largest image or text block visible within the viewport. The load time should be within 2.5 seconds of when the page first starts to load.
- Interaction to Next Paint (INP). This measure assesses a page’s overall responsiveness to user interactions by observing the time it takes to respond to all click, tap, and keyboard interactions that occur throughout a user’s visit to a page. A page with good responsiveness will have an INP of 200 milliseconds or less.
- Cumulative Layout Shift (CLS). Quantifies how often and how far elements move around above-the-fold (like content shifting down the page to make room for an advert). The CSL score should be 0.1 or less.
The Google Webmaster team announced that Core Web Vitals would be part of the Page Experience ranking update in mid-June 2021.
How to incorporate Lumar into your site speed toolkit
Lumar’s site speed metrics, cover Lighthouse performance metrics (or lab data) at scale, and origin-level field data from the Chrome User Experience Report (CrUX).
While the CrUX data includes all the Core Web Vitals metrics listed above, the Lighthouse performance metrics include LCP and CLS, but not INP. INP requires real user interactions, and lab tests can’t accurately predict when users will interact with a page, so any resulting value may not reflect how real users experience the page. Instead, Lighthouse includes Total Blocking Time (TBT) which is a slightly different measure of a page’s responsiveness, but for lab rather than field data.
By including both Lighthouse and origin-level CrUX data, Lumar gives you different perspectives on the performance of your site, to help you understand where to focus your efforts. While URL-level CrUX data has some specific limitations, we’re working on modifications that would allow us to incorporate it.
For those customers who do not have the full site speed module as part of their subscription, we do include a measure of LCP and CLS in our SEO projects. With these, however, we test a page’s performance in our own systems (lab data) and do not render images by default. The metrics are therefore intended to give a general indication of performance.
In addition to Lighthouse and origin-level CrUX data, our team recommends reading more into lab vs RUM data for site speed tools, the Chrome UX report, and creating your own CrUX dashboard.
What CWV metrics are available?
As mentioned above, Lumar’s Site Speed metrics include the following core metrics:
- First Contentful Paint (FCP) measures the time from when the page starts loading to when any part of the page’s content is rendered on the screen. FCP is available for both Lighthouse and CrUX data.
- Largest Contentful Paint (LCP) reports the render time of the largest image or text block visible within the viewport. LCP is available for both Lighthouse and CrUX data.
- Interaction to Next Paint (INP) measures how responsive a web page is by observing the latency of all the interactions a user has made with the page, and reporting a single value which all (or nearly all) interactions were beneath. INP uses field data, and is therefore only available for CrUX origin-level data.
- Cumulative Layout Shift (CLS) measures the sum total of all individual layout shift scores for every unexpected layout shift that occurs during the entire lifespan of the page. CLS is available for both Lighthouse and CrUX origin-level data.
- Total Blocking Time (TBT) measures the total amount of time after FCP where the main thread was blocked for long enough to prevent input responsiveness. This metrics uses lab data, and is therefore only available for Lighthouse data.
What reports are available?
Lumar has 90 reports in the site speed module, designed to give you actionable insights into the errors impacting the performance of your site. When you go into a Site Speed project, click on All Reports at the top of the dashboard to see them all. You can also drill into each core metric in the left-hand navigation and click on All Reports to see the reports that sit in that section.
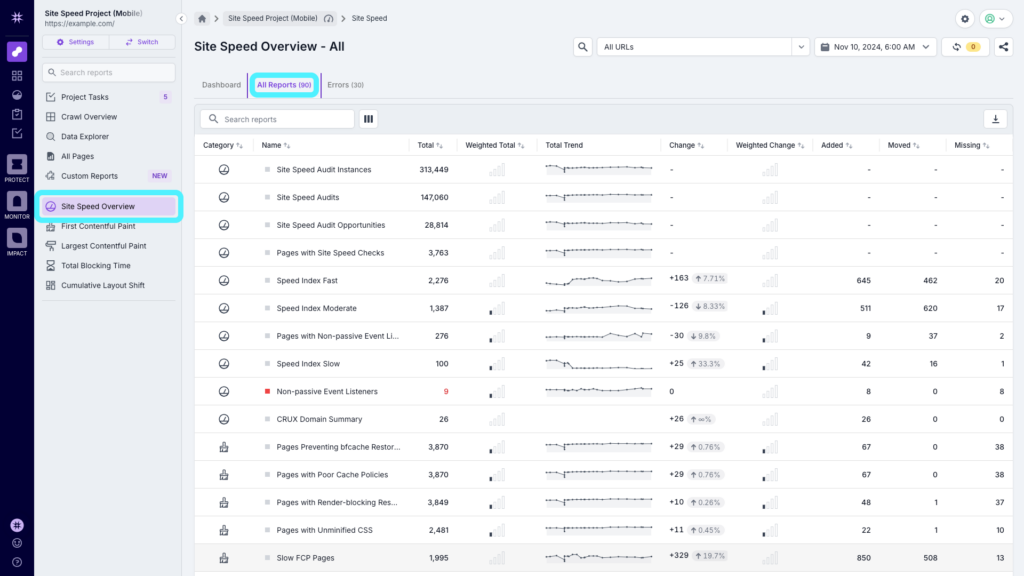
When you click into a report, you can get more information about what the report contains and how it can be used, by opening the guidance area at the top of the report.
As mentioned above, our SEO module also includes some basic reporting on the speed of your site. In addition to LCP and CLS, SEO projects also have some additional metrics including Time to Interactive (TTI), First Contentful Paint (FCP), Time to First Byte (TTFB), HTML size, and fetch time. Metrics in SEO projects are based on the Lighthouse metrics but use our own systems, and generally include reports for Fast, Average, and Slow, or Good, Average, and Poor, depending on the metric.
How can I get started?
To access our full site speed metrics, you will need to add the module to your subscription. If you’d like to do this, simply get in touch and one of our team will help you through the process.
If you’re an existing customer with our Technical SEO module, you can access the overview reports in the Page Speed section of the Experience category. Just note that the JavaScript rendering feature needs to be enabled to capture the metrics in your next crawl.
Frequently Asked Questions
How does Lumar measure Core Web Vitals?
Within our full Site Speed Metrics module, Lumar requests a page and runs the Lighthouse library on our own servers. For CrUX, we use the CrUX API.
Within the SEO module, Lumar uses our own Page Rendering Service (PRS) to crawl and render the HTML, and capture Core Web Vital and web performance scores in a lab environment.
Is this data available in Data Studio?
Yes, all our reports are available in our Data Studio connector. To add these reports to an existing dashboard, you must edit the data source and reconnect it to allow it to find these new data points.
Will the new metrics and reports be available in the API?
Yes. Please read our API documentation to understand how to start pulling the data into your own workflows.
How can I improve my performance or Web Vital scores?
Lumar’s full Site Speed module gives you insights into the specific issues that are negatively impacting speed performance. You can use these reports to filter down to an actionable set of data, so you can make concrete improvements to the speed of your site.
Will I still need custom extraction reports for performance data?
Our team recommends reviewing all the new performance reports and if they meet your needs, remove any unnecessary custom extractions.


